Page overview
This topic introduces the NebulaGraph Explorer page to help you learn more about NebulaGraph Explorer's functions.
The NebulaGraph Explorer page consists of three modules top navigation bar, left-side navigation bar, and canvas.
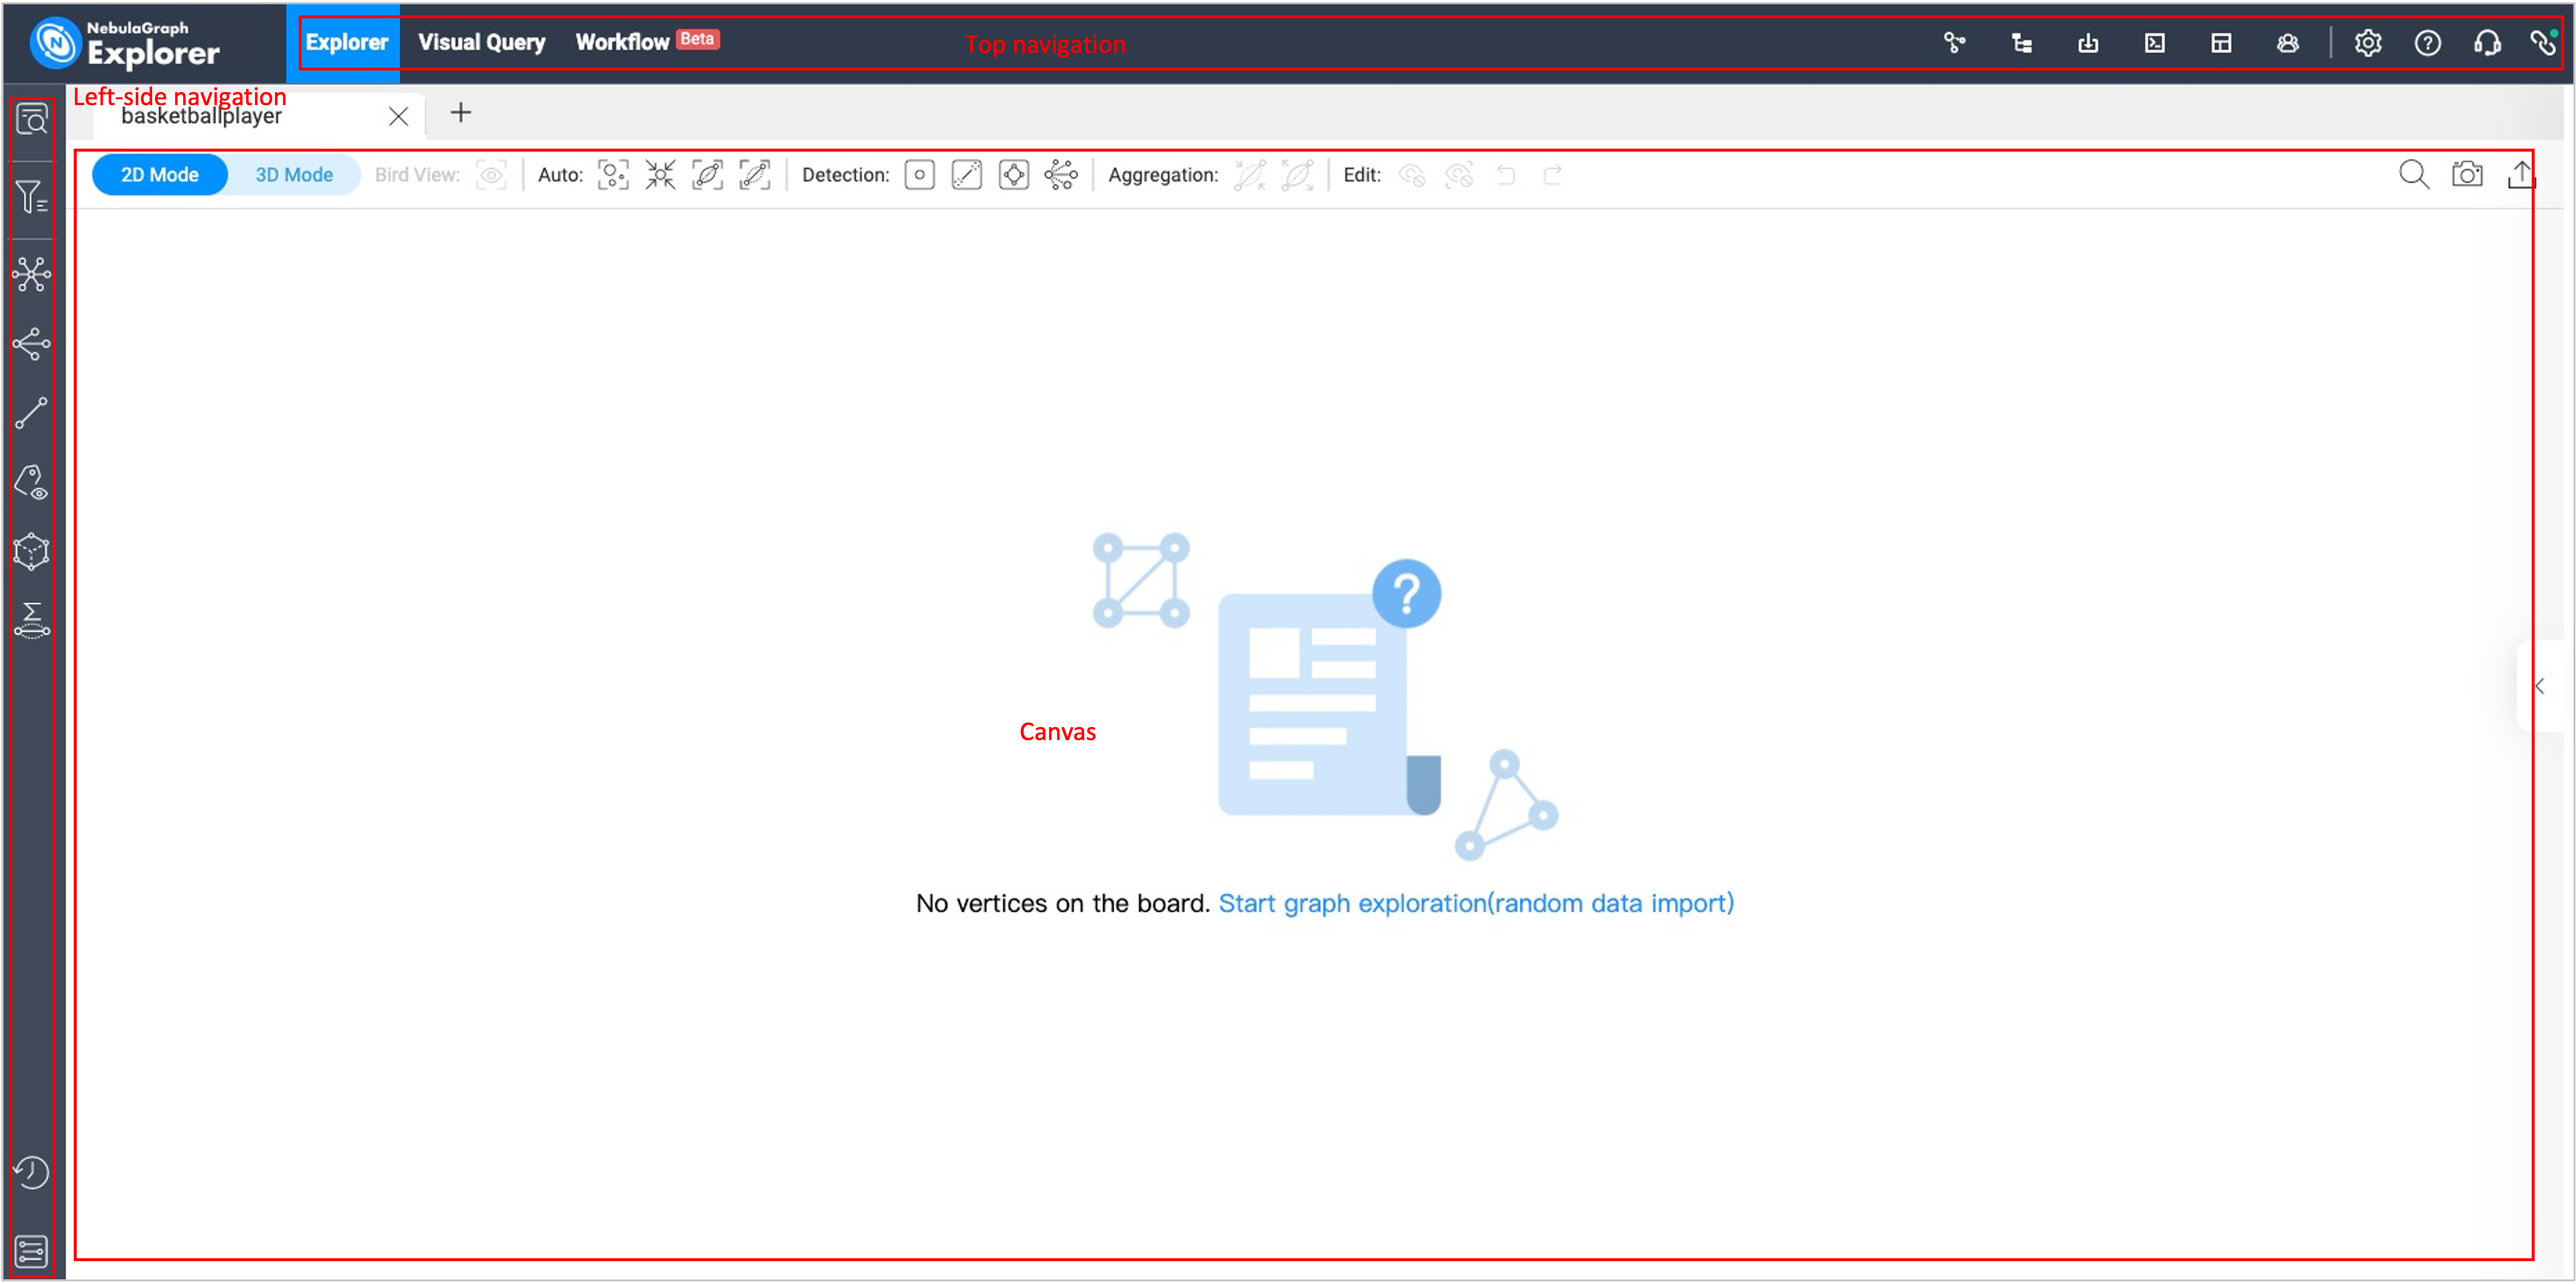
Top navigation bar
| Icon/Element | Description |
|---|---|
| Explorer | Visually explore and analyze data. For more information, see Start querying, Vertex Filter, Graph exploration and Graph algorithm. |
| Visual Query | Visually construct scenarios for data queries. For more information, see Visual Query. |
| Workflow | Visually construct custom workflows for complex graph computing. The Workflow page can be displayed only when Workflow is enabled in  . For more information, see Workflow overview. . For more information, see Workflow overview. |
 |
Users can design their schemas on the canvas to visually display the relationships between vertices and edges. For more information, see Schema drafting. |
 |
Manage NebulaGraph database graph spaces. For more information, see Create a schema. |
 |
Bulk import of data into NebulaGraph. For more information, see Import data. |
 |
Query the NebulaGraph data with nGQL statements. For more information, see Console. |
| The template of the nGQL. For details, see nGQL template. | |
 |
Manage the users in NebulaGraph database. For more information, see Database user Management。 |
|
Global Settings. You can set the language of the Explorer page, enable Beta functions, and the maximum number of canvas query results. |
 |
Guide and help you in using NebulaGraph. |
 |
Feedback page. You can report troubles, submit suggestions, participate in research, or contact the NebulaGraph team. |
 |
Show the connection information and version information. You can change passwords and log out. |
Left-side navigation bar
Note
After logging into Explorer, select a graph space and click on it to unlock query and exploration functions in the left-side navigation bar. For more information, see Choose graph spaces.
Click the icons in the left-side navigation bar to import, analyze, and explore graph data. The descriptions of the icons are as follows:
| Icon | Description |
|---|---|
 |
Enter VIDs or tags to query data. For more information, see Ways to query data. |
 |
Search for target vertexes displayed on the canvas. For more information, see Filter vertices. |
 |
Perform explorations on the vertices on the canvas by setting edge directions, steps, and filtering conditions. For more information, see Graph exploration. |
 |
Select at least two vertices on the canvas to search for their common neighbors. For more information, see Graph exploration. |
 |
Find all paths, the shortest path, and the non-loop paths from the source to the destination vertex. For more information, see Graph exploration. |
 |
Choose whether to display the properties of vertices or edges on the canvas. For more information, see Graph exploration. |
 |
Perform graph computing based on the vertexes and edges on the canvas. For more Information see Graph computing. |
| Perform property calculation based on the aggregated edges on the canvas. For more Information see Property calculation。 | |
 |
View historical snapshots. For more information, see Canvas snapshots. |
 |
View all graph spaces. Click a graph space to create a canvas corresponding to it. For more information, see Choose graph spaces. |
Canvas
Note
After logging into Explorer, select a graph space and click on it to enter the canvas page. For more information, see Choose graph spaces.
Graph data can be displayed visually on a canvas. The canvas consists of the following parts:
- Tabs on the Top
- Visualization modes
- Data storage
- Search box
- Layouts
- Minimap
- Data overview
For more information, see Canvas overview.