Cluster diagnostics
The cluster diagnostics feature in Dashboard Enterprise Edition is to locate and analyze the current cluster problems within a specified time range and summarize the diagnostic results and cluster monitoring information to web-based diagnostic reports.
Features
- Diagnostic reports allow you to troubleshoot the current cluster problems within a specified time range.
- Quickly understand the basic information of the nodes, services, service configurations, and query sessions in the cluster.
- Based on the diagnostic reports, you can make operation and maintenance recommendations and cluster alerts.
Entry
- In the top navigation bar of the Dashboard Enterprise Edition page, click Cluster Management.
- On the right side of the target cluster, click Detail.
- In the left navigation bar, click Analysis->Cluster Diagnostics.
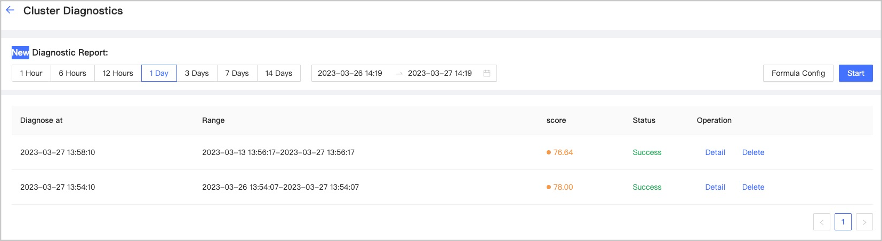
Create diagnostic reports
-
Select a time range for diagnostics. You can customize the time range or set the range by selecting time intervals, including
1 Hour,6 Hours,12 Hours,1 Day,3 Days,7 Days, and14 Days.Caution
Note that the end time of the diagnostic range you set cannot be longer than the current time. If the end time is longer than the current time, the end time will be set to the current time.
-
Confirm the configuration of the Formula Config. Users can adjust the formula manually.
The weight function in the formula is
weight(value>conditionValue , weightValue), where the numbers in the blue font support modification. The method for calculating the value of the function is(value - conditionValue * timeRange)/((maxValue - conditionValue) * timeRange) * weightValue.- value: Current metric value.
- conditionValue: The lowest value that matches the condition.
- timeRange: The number of days in the time range. For avg type metrics, the value of this parameter is 1.
- maxValue: The maximum metric value. The value for the percentage type is 100, and the value for the rest of the types is 2 times the conditionValue.
For example,
weight(hit_memory_times > 10 * days, 10), when the time range is selected as 2 days andhit_memory_times = 40, the formula is(40 - 10 * 2)/((10*2 - 10) * 2) * 10 = 10。 -
Click Start.
-
Wait for the diagnostic report to be generated. When the diagnostic status is changed to success, the diagnostic report is ready.
View diagnostic reports
In the diagnostic report list, you can view the diagnostic reports by clicking Detail on the right side of the target report.
A diagnostic report contains the following information:
- Basic Info
- Displays information that needs to be focused on, such as emergency alarms, warning alarms, tips, etc.
- Display cluster health score, maximum average CPU usage, maximum average memory usage, etc.
- Node Info
- Display the Host, instances, architecture, and system of each node.
- Display CPU, memory, disk, and network traffic of each node.
- Service Info
- Show the online status and session information of each service.
- Display graph, meta, and storage service stability information.
- Configuration Info
- Display configuration change information.
You can also download the diagnostic report in HTML or PDF format.