Cluster Overview
This topic introduces the Cluster Overview page of Dashboard, which contains the following parts:
- Info Overview
- Cluster Topology
- Monitoring Screen
Entry
- At the top navigation bar of the Dashboard Enterprise Edition page, click Cluster Management.
- Click Detail on the right of the cluster management page to check the overview of a specified cluster.
Info Overview
Cluster key information
In the cluster key information, the following information is displayed.
- Cluster health score: Displays the health of the cluster on a percentage basis. It is refreshed every 5 minutes, or immediately if there is an emergency level alarm. The calculation formula can be configured on the Cluster Diagnosis page.
- Monitoring nodes and services: Display the number of online nodes/total nodes and the number of online services/total services. Different types of services are displayed separately. Click on
 to access the Service page.
 - Number of slow queries (5min): The number of slow queries in the cluster in the last 5 minutes.
- Newly created sessions (5min): The number of newly created sessions in the cluster in the last 5 minutes.
- Latest backup time: The latest backup time of the cluster. Click on to access the Backup and Restore page.
- Total storage usage: The total storage usage of the cluster. Click on to display more details.
Cluster monitoring panel
In the cluster monitoring panel, users can select and view monitoring data from different periods. Users can either select a custom time range or choose from predefined time ranges such as the last 5 minutes, 1 hour, 6 hours, 12 hours, 1 day, and 3 days. The monitoring panel displays the following information:
- QPS: The time-series diagram of the QPS.
- Query latency(P95): The time-series diagram of the query latency.
- CPU usage: The CPU usage of the cluster.
- Memory Utilization: The memory utilization of the cluster.
- Opened sessions: The total number of sessions created in the cluster.
- Slow Query: The number of slow queries in the cluster.
Users can click to jump to the detailed service monitoring panel page.
Cluster topology
Shows the distribution and status of nodes and services in the cluster. Click Cluster Topology at the top of the page to enter the Cluster Topology page.
Monitoring screen
The monitoring screen helps users understand the health status of the cluster and the information on services and nodes at a glance.
Click Switch to Monitoring Screen to enter the monitoring screen page.
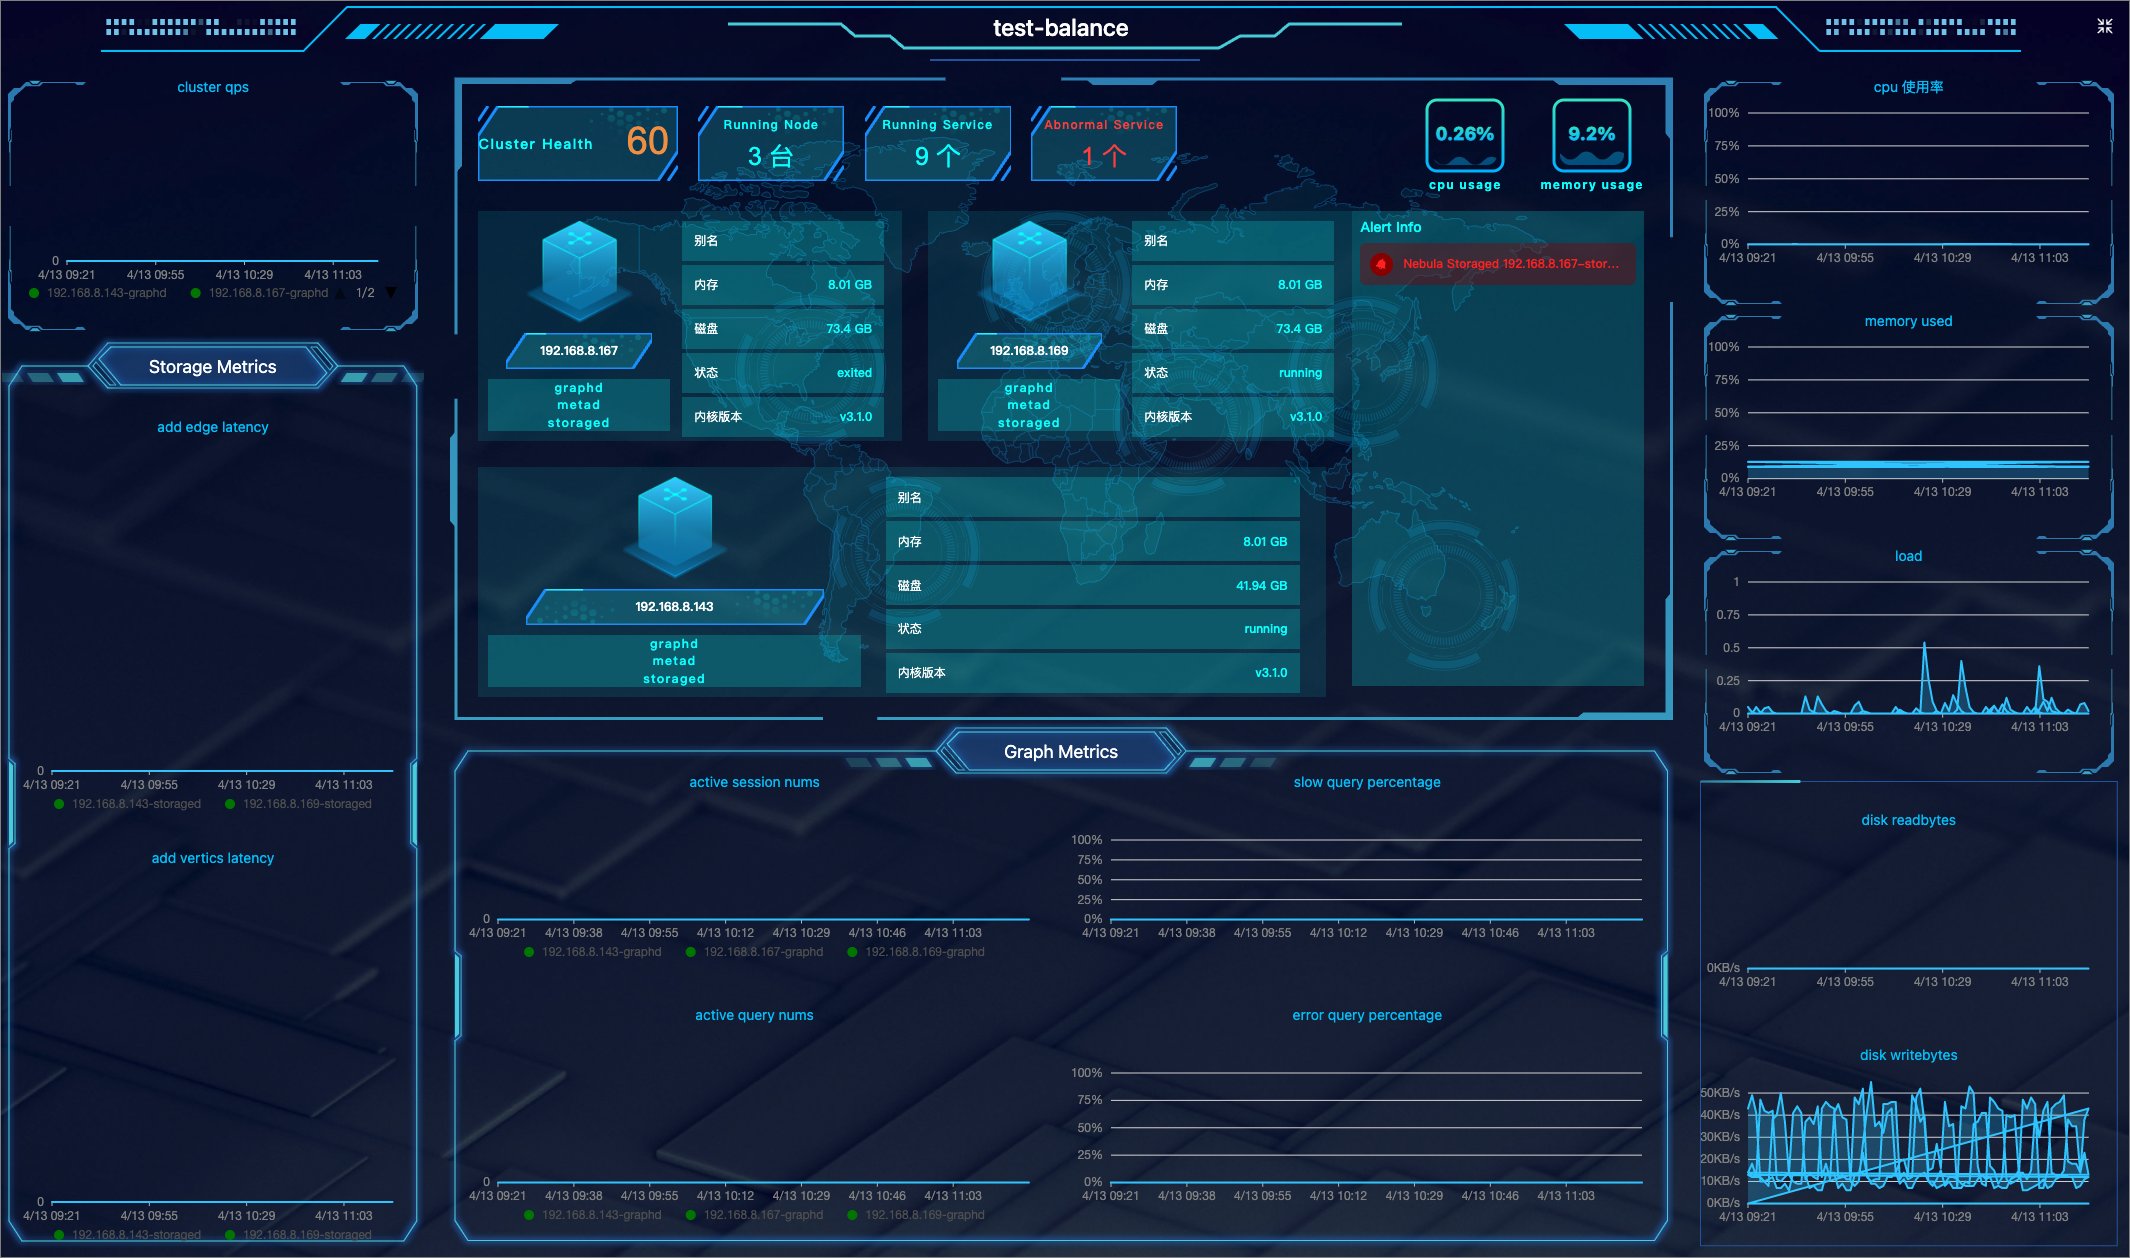
| Screen area | Information displayed |
|---|---|
| Upper middle area | 1. The health degree of your cluster. The system scores the health of your cluster. For more information, see the following note. 2. The information and number of running nodes, the number of running services and abnormal services in the cluster. 3. CPU and memory usage of the node at the current time. 4. Alert notifications. The system displays the 5 most recently triggered alert messages based on their severity level (emergency>critical>warning). For more information, Monitoring alerts. |
| Lower middle area | Monitoring information of 4 Graph service metrics at different periods. The 4 metrics are: 1. num_active_sessions 2. num_slow_queries 3. num_active_queries 4. num_query_errors |
| Left side of the area | 1. QPS (Query Per Second) of your cluster. 2. The monitoring information of 2 Storage service metrics at different periods. The two metrics are: add_edges_latency_us,add_vertices_latency_us. |
| Right side of the area | The node-related metrics information at different periods. Metrics include: 1. cpu_utilization 2. memory_utilization 3. load_1m 4. disk_readbytes 5. disk_writebytes |
For more information about the monitoring metrics, see Metrics.
Note
Cluster scoring rules are as follows:
- The maximum score is 100; The minimum score is 13.
- When 100≥Health Degree≥80, the score is blue; When 80>Health Degree≥60, the score is yellow; When Health Degree<60, the score is yellow.
- Algorithm: (1-number of abnormal services/total number of services)*100%.
- Except for the appearance of the first
emergencylevel alert that deducts 40 points, 10 points are deducted for each of the otheremergencylevel alerts and other levels of alerts.