Dashboard
NebulaGraph Dashboard consists of three parts: Machine, Service, and Management. This topic will describe them in detail.
Overview
Machine
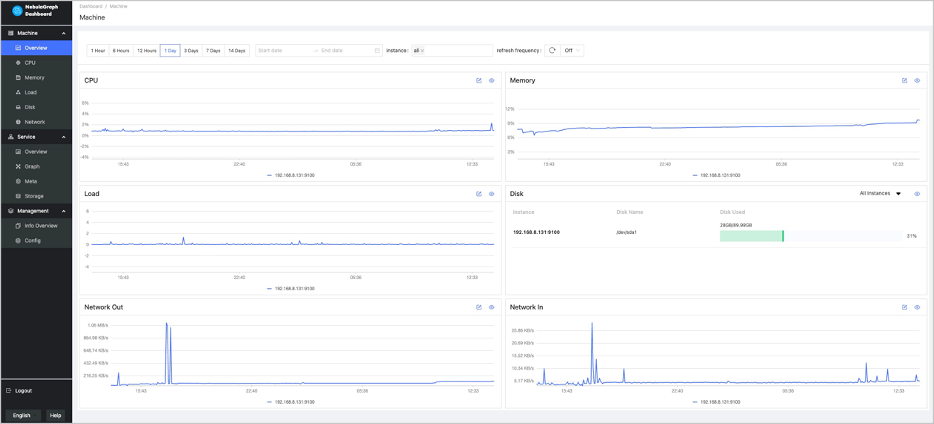
Click Machine->Overview to enter the machine overview page.
On this page, you can view the variation of CPU, Memory, Load, Disk, and Network In/Out quickly.
- By default, you can view the monitoring data for a maximum of 14 days. You can also select a time range or quickly select the latest 1 hour, 6 hours, 12 hours, 1 day, 3 days, 7 days, or 14 days.
- By default, you can view the monitoring data of all the instances in clusters. You can select the instances you want to view in the instance box.
- By default, the monitoring information page will not be updated automatically. You can set the update frequency of the monitoring information page globally or click the
 button to update the page manually.
 - To set a base line, click the
 button.
 -
To view the detailed monitoring information, click the
 button. In this example, select
 Loadfor details. The figure is as follows.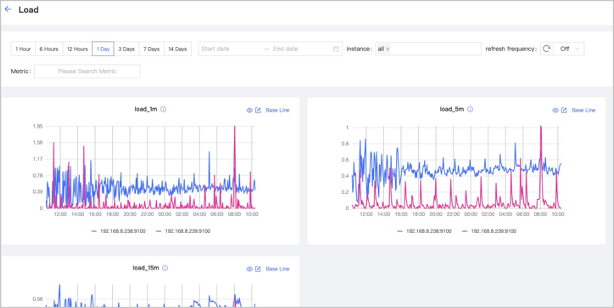
- You can set the monitoring time range, instance, update frequency and base line.
- You can search for or select the target metric. For details about monitoring metrics, see Metrics.
- You can temporarily hide nodes that you do not need to view.
- You can click the button to view the detailed monitoring information.
Service
Click Service->Overview to enter the service overview page.
On this page, you can view the information of Graph, Meta, and Storage services quickly. In the upper right corner, the number of normal services and abnormal services will be displayed.
Note
In the Service page, only two monitoring metrics can be set for each service, which can be adjusted by clicking the Set up button.
- By default, you can view the monitoring data for a maximum of 14 days. You can also select a time range or quickly select the latest 1 hour, 6 hours, 12 hours, 1 day, 3 days, 7 days, or 14 days.
- By default, you can view the monitoring data of all the instances in clusters. You can select the instances you want to view in the instance box.
- By default, the monitoring information page will not be updated automatically. You can set the update frequency of the monitoring information page globally or click the button to update the page manually.
- You can view the status of all the services in a cluster.
-
To view the detailed monitoring information, click the
button. In this example, select Graphfor details. The figure is as follows.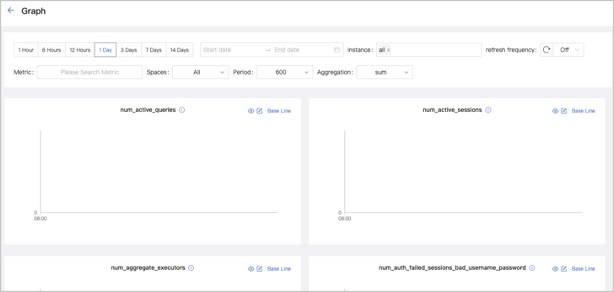
- You can set the monitoring time range, instance, update frequency, period, aggregation and base line.
- You can search for or select the target metric. For details of monitoring metrics, see Monitor parameter.
- You can temporarily hide nodes that you do not need to view.
- You can click the button to view the detailed monitoring information.
- The Graph service supports a set of space-level metrics. For more information, see the following section Graph space.
Graph space
Note
Before using graph space metrics, you need to set enable_space_level_metrics to true in the Graph service. For details, see [Graph Service configuration](../5.configurations-and-logs/1.configurations/3.graph-config.md.
Space-level metric incompatibility
If a graph space name contains special characters, the corresponding metric data of that graph space may not be displayed.
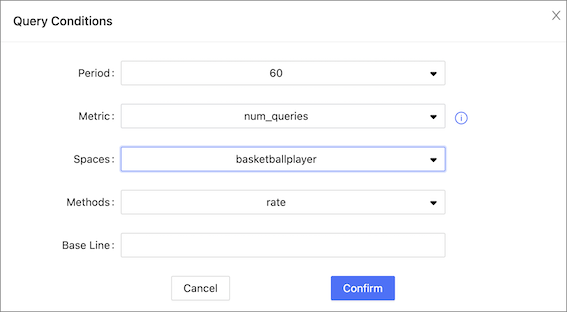
The service monitoring page can also monitor graph space level metrics. Only when the behavior of a graph space metric is triggered, you can specify the graph space to view information about the corresponding graph space metric.
Space graph metrics record the information of different graph spaces separately. Currently, only the Graph service supports a set of space-level metrics.
For information about the space graph metrics, see Graph space.
Management
Overview info
On the Overview Info page, you can see the information of the NebulaGraph cluster, including Storage leader distribution, Storage service details, versions and hosts information of each NebulaGraph service, and partition distribution and details.
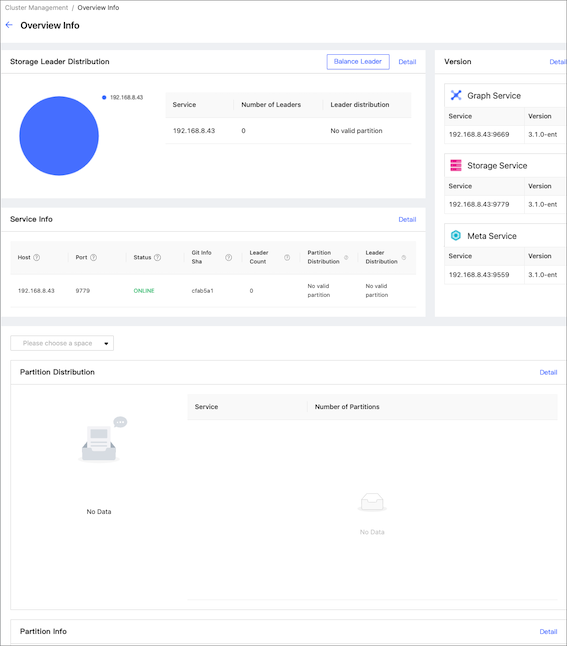
Storage Leader Distribution
In this section, the number of Leaders and the Leader distribution will be shown.
- Click the Balance Leader button in the upper right corner to distribute Leaders evenly and quickly in the NebulaGraph cluster. For details about the Leader, see Storage Service.
- Click Detail in the upper right corner to view the details of the Leader distribution.
Version
In this section, the version and host information of each NebulaGraph service will be shown. Click Detail in the upper right corner to view the details of the version and host information.
Service information
In this section, the information on Storage services will be shown. The parameter description is as follows:
| Parameter | Description |
|---|---|
Host |
The IP address of the host. |
Port |
The port of the host. |
Status |
The host status. |
Git Info Sha |
The commit ID of the current version. |
Leader Count |
The number of Leaders. |
Partition Distribution |
The distribution of partitions. |
Leader Distribution |
The distribution of Leaders. |
Click Detail in the upper right corner to view the details of the Storage service information.
Partition Distribution
Select the specified graph space in the upper left corner, you can view the distribution of partitions in the specified graph space. You can see the IP addresses and ports of all Storage services in the cluster, and the number of partitions in each Storage service.
Click Detail in the upper right corner to view more details.
Partition information
In this section, the information on partitions will be shown. Before viewing the partition information, you need to select a graph space in the upper left corner. The parameter description is as follows:
| Parameter | Description |
|---|---|
Partition ID |
The ID of the partition. |
Leader |
The IP address and port of the leader. |
Peers |
The IP addresses and ports of all the replicas. |
Losts |
The IP addresses and ports of faulty replicas. |
Click Detail in the upper right corner to view details. You can also enter the partition ID into the input box in the upper right corner of the details page to filter the shown data.
Config
It shows the configuration of the NebulaGraph service. NebulaGraph Dashboard Community Edition does not support online modification of configurations for now.
Others
In the lower left corner of the page, you can:
- Sign out
- Switch between Chinese and English
- View the current Dashboard release
- View the user manual and forum
- Fold the sidebar