Cluster monitoring
This section introduces the monitoring function of the Dashboard, including default monitoring and custom monitoring.
At the top navigation bar of the Dashboard Enterprise Edition page, click Cluster Management, and click Detail at the right of the target cluster. Monitoring at the left navigation bar contains default monitoring and custom monitoring.
Default monitoring
The default cluster monitoring page of Dashboard displays 8 monitoring metric panels, which cannot be modified or deleted. Users can add, modify, and delete monitoring metric panels in a new dashboard using the Custom Monitoring function described below.
The 8 default monitoring metrics displayed are:
- CPU Utilization: Percentage of CPU usage.
- Memory Utilization: Percentage of memory usage.
- Disk Usage: Disk usage shows instances, disk name, mount point, and usage.
- Load 5: System average load over the last 5 minutes.
- QPS: Queries per second.
- Num Queries & Slow Queries: Number of queries and slow queries.
- Num Opened Sessions: Number of active sessions.
- Add Edge Latency & Add Vertex Latency: Delay time for adding edges and vertices.
Clicking the  button on the upper right corner of each panel can filter the time and view each monitoring metric on a separate subpage.
Custom Monitoring
Creating Monitoring
-
Click on New Dashboard and enter a custom Dashboard name in the pop-up dialog box. Click OK to create a new cluster monitoring.
-
Click on Add Panel in the upper right corner or Create Panel in the middle of the page to add a monitoring panel. Set the parameters and click Confirm. The parameter descriptions are as follows:
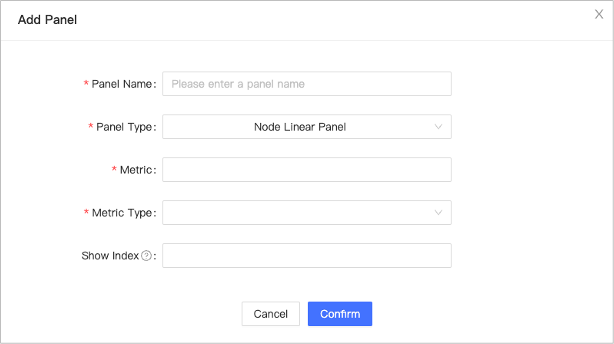
- Panel Name: Custom panel name.
- Panel Type: Includes Node Linear Panel, Service Linear Panel, and Disk Usage Bar Panel. Different panel types determine the available metrics for selection.
- Metric: Select different metrics based on the panel type. For example, for Node Linear Panel, you can select CPU, Memory, Load, Disk, Network In/Out, etc. Multiple metrics can be selected. Please refer to the Metrics for more details.
- Metric Type: Choose from percentage, byte, byte/s, io/s, number, etc.
- Show Index: Panel display order, with numbers ranging from 1 to infinity, with smaller numbers being displayed first. The panels are sorted by the creation time by default.
Note
The Graph service supports a set of graph space-based monitoring metrics. When selecting Graph service-related metrics, you can select the corresponding graph space in the added spaces dropdown list.
Caution
Before using Graph Space Metrics, users need to set enable_space_level_metrics to true in the Graph service. For specific operations, see Update config.
Managing Monitoring
To manage monitoring metric panels, click the  button in the upper right corner of each panel to modify or delete the panel.
You can also click the button in the upper right corner of the panel to enter the subpage of the monitoring metrics panel and view the monitoring metrics.
More operations
The section above the page is used for monitoring filtering, with the following features:
- Time selection: By default, 6 hours of monitoring data is selected for viewing. You can select a time based on a specific date, or choose a recent period, such as the past 5 minutes, 1 hour, 6 hours, 12 hours, 1 day, or 3 days.
- Instance selection: Monitoring data for all nodes is displayed by default, and you can adjust the selections within the Instance box.
- Service selection: Monitoring data for all services is displayed by default, and you can adjust the selections within the Service box.
- Data update: The monitoring data on the page is not automatically updated by default (i.e., it is turned
Off). You can set the page update frequency in the drop-down box, such as every 5 seconds, 30 seconds, or 5 minutes. Click the button to manually update the data.