Console
Studio console interface is shown as follows.
Entry
In the top navigation bar, click Console.
Overview
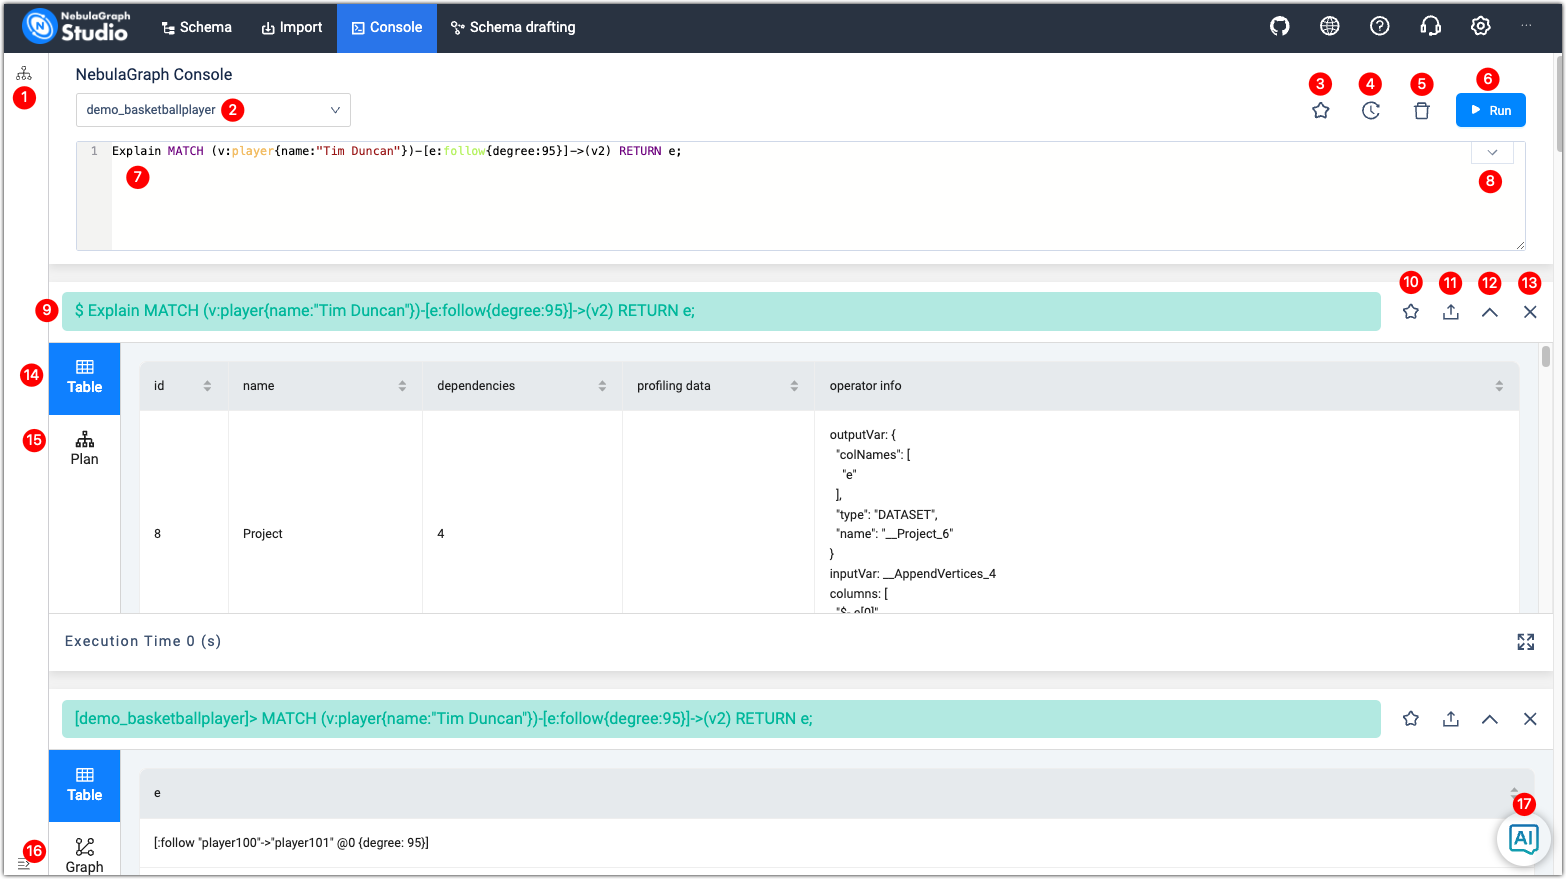
The following table lists the functions on the console page.
| number | function | descriptions |
|---|---|---|
| 1 | View the schema | Display the schemas of the graph spaces. |
| 2 | Select a space | Select a space in the graph space drop down list. The console does not support using the USE <space_name> statement to switch graph spaces. |
| 3 | Favorites | Click the  button to expand the favorites. Select a statement, and it automatically populates the input box. button to expand the favorites. Select a statement, and it automatically populates the input box. |
| 4 | History list | Click the  button to view the execution history. In the execution history list, click one of the statements, and the statement is automatically populates the input box. The list provides the record of the last 15 statements.Type button to view the execution history. In the execution history list, click one of the statements, and the statement is automatically populates the input box. The list provides the record of the last 15 statements.Type / in the input box to quickly select a historical query statement. |
| 5 | Clean input box | Click the  button to clear the content populated in the input box. button to clear the content populated in the input box. |
| 6 | Run | After entering the nGQL statement in the input box, click the  button to start running the statement. button to start running the statement. |
| 7 | Input box | The area where the nGQL statement is entered. The statement displays different colors depending on the schemas or character strings. Code auto-completion is supported. You can quickly enter a tag or edge type based on the schema.You can input multiple statements and run them at the same time by using the separator ;. Use the symbol // to add comments.Support right-clicking on a selected statement and then performing operations such as cut, copy, or run. |
| 8 | Custom parameters display | Click the  button to expand the custom parameters for the parameterized query. For details, see Manage parameters. button to expand the custom parameters for the parameterized query. For details, see Manage parameters. |
| 9 | Statement running status | After running the nGQL statement, the statement running status is displayed. If the statement runs successfully, the statement is displayed in green. If the statement fails, the statement is displayed in red. |
| 10 | Add to favorites | Click the button to save the statement as a favorite. The button for the favorite statement is colored in yellow. |
| 11 | Export CSV file or PNG file | After running the nGQL statement to return the result, when the result is in the Table window, click the  button to export as a CSV file. Switch to the Graph window and click the button to export the results as a CSV file or a PNG image. button to export as a CSV file. Switch to the Graph window and click the button to export the results as a CSV file or a PNG image. |
| 12 | Expand/hide execution results | Click the  button to hide the result or click button to hide the result or click  to expand the result. to expand the result. |
| 13 | Close execution results | Click the  button to close the result returned by this nGQL statement. button to close the result returned by this nGQL statement. |
| 14 | Table window | Display the results returned by the nGQL statement in a table. |
| 15 | Plan window | Display the execution plan. If an EXPLAIN or PROFILE statement is executed, the window presents the execution plan in visual form. See the description of the execution plan below. |
| 16 | Graph window | Display the results returned by the nGQL statement in a graph if the results contain complete vertex and edge information. Click the  button on the right to view the overview panel. button on the right to view the overview panel. |
| 17 | AI Assistant | You can chat with an AI assistant to convert natural language instructions into nGQL query statements and then copy the nGQL statements into the input box with one click. This feature needs to be set up and enabled in the system settings before use.Note: The schema information of the current graph space is sent to the large language model when you chat with the assistant. Please pay attention to information security.You can click the text2match toggle to switch between general Q&A and query Q&A. The query Q&A can convert the natural language instructions to nGQL query statements. |
Execution plan descriptions
The Studio can display the execution plan of the statement. The execution plan descriptions are as follows.
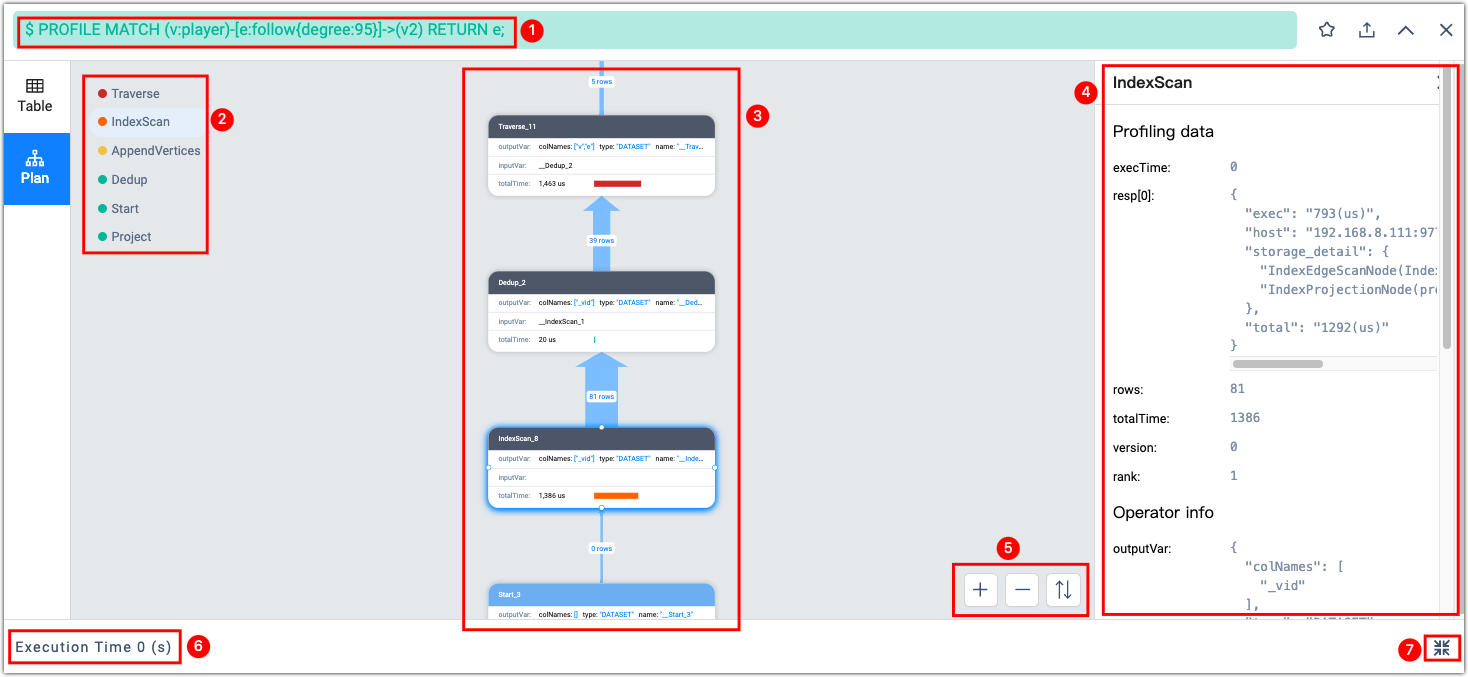
| No. | Description |
|---|---|
| 1 | An EXPLAIN or PROFILE statement. |
| 2 | The operators used by the execution plan, which are sorted according to the execution duration. The top three operators are labeled as red, orange, and yellow, respectively. Clicking on an operator directly selects the corresponding operator in the operator execution flow and displays the operator information.Note: The PROFILE statement actually executes the statement, and the actual execution durations can be obtained and sorted. The EXPLAIN statement does not execute the statement, and all operators are considered to have the same execution duration and are all labeled as red. |
| 3 | The operator execution flow. For each operator, the following information is displayed: in-parameters, out-parameters, and total execution duration.The Select, Loop, PassThrough, and Start operators have independent color schemes.The arrows show the direction of data flow and the number of rows. The thicker the arrows, the more rows of data. You can click on the operator to check the details of the operator on the right side. |
| 4 | The details of the operator, divided into Profiling data and Operator info.Profiling data shows the performance data of the operator, including the rows of data received, the execution time, the total time, etc.Operator info shows the detailed operation information of the operator. |
| 5 | Zoom out, zoom in, or reverse the execution flow. |
| 6 | The duration of the statement. |
| 7 | Full screen or cancel full screen. |
Last update:
February 1, 2024