FAQ
This topic lists the frequently asked questions for using NebulaGraph master. You can use the search box in the help center or the search function of the browser to match the questions you are looking for.
If the solutions described in this topic cannot solve your problems, ask for help on the NebulaGraph forum or submit an issue on GitHub issue.
About manual updates
"Why is the behavior in the manual not consistent with the system?"
NebulaGraph is still under development. Its behavior changes from time to time. Users can submit an issue to inform the team if the manual and the system are not consistent.
Note
If you find some errors in this topic:
- Click the
pencilbutton at the top right side of this page. - Use markdown to fix this error. Then click "Commit changes" at the bottom, which will start a Github pull request.
- Sign the CLA. This pull request will be merged after the acceptance of at least two reviewers.
About legacy version compatibility
Compatibility
Neubla Graph master is not compatible with NebulaGraph 1.x nor 2.0-RC in both data formats and RPC-protocols, and vice versa. The service process may quit if using an lower version client to connect to a higher version server.
To upgrade data formats, see Upgrade NebulaGraph to the current version. Users must upgrade all clients.
About execution errors
"How to resolve the error -1005:GraphMemoryExceeded: (-2600)?"
This error is issued by the Memory Tracker when it observes that memory usage has exceeded a set threshold. This mechanism can help avoid service processes from being terminated by the system's OOM (Out of Memory) killer. Steps to resolve:
-
Check memory usage: First, you need to check the memory usage during the execution of the command. If the memory usage is indeed high, then this error might be expected.
-
Check the configuration of the Memory Tracker: If the memory usage is not high, check the relevant configurations of the Memory Tracker. These include
memory_tracker_untracked_reserved_memory_mb(untracked reserved memory in MB),memory_tracker_limit_ratio(memory limit ratio), andmemory_purge_enabled(whether memory purge is enabled). For the configuration of the Memory Tracker, see memory tracker configuration. -
Optimize configurations: Adjust these configurations according to the actual situation. For example, if the available memory limit is too low, you can increase the value of
memory_tracker_limit_ratio.
"How to resolve the error SemanticError: Missing yield clause.?"
Starting with NebulaGraph 3.0.0, the statements LOOKUP, GO, and FETCH must output results with the YIELD clause. For more information, see YIELD.
"How to resolve the error Host not enough!?"
From NebulaGraph version 3.0.0, the Storage services added in the configuration files CANNOT be read or written directly. The configuration files only register the Storage services into the Meta services. You must run the ADD HOSTS command to read and write data on Storage servers. For more information, see Manage Storage hosts.
"How to resolve the error To get the property of the vertex in 'v.age', should use the format 'var.tag.prop'?"
From NebulaGraph version 3.0.0, patterns support matching multiple tags at the same time, so you need to specify a tag name when querying properties. The original statement RETURN variable_name.property_name is changed to RETURN variable_name.<tag_name>.property_name.
"How to resolve Used memory hits the high watermark(0.800000) of total system memory.?"
The error may be caused if the system memory usage is higher than the threshold specified bysystem_memory_high_watermark_ratio, which defaults to 0.8. When the threshold is exceeded, an alarm is triggered and NebulaGraph stops processing queries.
Possible solutions are as follows:
- Clean the system memory to make it below the threshold.
- Modify the Graph configuration. Add the
system_memory_high_watermark_ratioparameter to the configuration files of all Graph servers, and set it greater than0.8, such as0.9.
However, the system_memory_high_watermark_ratio parameter is deprecated. It is recommended that you use the Memory Tracker feature instead to limit the memory usage of Graph and Storage services. For more information, see Memory Tracker for Graph service and Memory Tracker for Storage service.
"How to resolve the error Storage Error E_RPC_FAILURE?"
The reason for this error is usually that the storaged process returns too many data back to the graphd process. Possible solutions are as follows:
- Modify configuration files: Modify the value of
--storage_client_timeout_msin thenebula-graphd.conffile to extend the connection timeout of the Storage client. This configuration is measured in milliseconds (ms). For example, set--storage_client_timeout_ms=60000. If this parameter is not specified in thenebula-graphd.conffile, specify it manually. Tip: Add--local_config=trueat the beginning of the configuration file and restart the service. - Optimize the query statement: Reduce queries that scan the entire database. No matter whether
LIMITis used to limit the number of returned results, use theGOstatement to rewrite theMATCHstatement (the former is optimized, while the latter is not). - Check whether the Storaged process has OOM. (
dmesg |grep nebula). - Use better SSD or memory for the Storage Server.
- Retry.
"How to resolve the error The leader has changed. Try again later?"
It is a known issue. Just retry 1 to N times, where N is the partition number. The reason is that the meta client needs some heartbeats to update or errors to trigger the new leader information.
If this error occurs when logging in to NebulaGraph, you can consider using df -h to view the disk space and check whether the local disk is full.
"How to resolve Schema not exist: xxx?"
If the system returns Schema not exist when querying, make sure that:
- Whether there is a tag or an edge type in the Schema.
- Whether the name of the tag or the edge type is a keyword. If it is a keyword, enclose them with backquotes (`). For more information, see Keywords.
Unable to download SNAPSHOT packages when compiling Exchange, Connectors, or Algorithm
Problem description: The system reports Could not find artifact com.vesoft:client:jar:xxx-SNAPSHOT when compiling.
Cause: There is no local Maven repository for storing or downloading SNAPSHOT packages. The default central repository in Maven only stores official releases, not development versions (SNAPSHOTs).
Solution: Add the following configuration in the profiles scope of Maven's setting.xml file:
  <profile>
     <activation>
        <activeByDefault>true</activeByDefault>
     </activation>
     <repositories>
        <repository>
            <id>snapshots</id>
            <url>https://oss.sonatype.org/content/repositories/snapshots/</url>
            <snapshots>
               <enabled>true</enabled>
            </snapshots>
      </repository>
     </repositories>
  </profile>
"How to resolve [ERROR (-1004)]: SyntaxError: syntax error near?"
In most cases, a query statement requires a YIELD or a RETURN. Check your query statement to see if YIELD or RETURN is provided.
"How to resolve the error can’t solve the start vids from the sentence?"
The graphd process requires start vids to begin a graph traversal. The start vids can be specified by the user. For example:
> GO FROM ${vids} ...
> MATCH (src) WHERE id(src) == ${vids}
# The "start vids" are explicitly given by ${vids}.
It can also be found from a property index. For example:
# CREATE TAG INDEX IF NOT EXISTS i_player ON player(name(20));
# REBUILD TAG INDEX i_player;

> LOOKUP ON player WHERE player.name == "abc" | ... YIELD ...
> MATCH (src) WHERE src.name == "abc" ...
# The "start vids" are found from the property index "name".
Otherwise, an error like can’t solve the start vids from the sentence will be returned.
"How to resolve the error Wrong vertex id type: 1001?"
Check whether the VID is INT64 or FIXED_STRING(N) set by create space. For more information, see create space.
"How to resolve the error The VID must be a 64-bit integer or a string fitting space vertex id length limit.?"
Check whether the length of the VID exceeds the limitation. For more information, see create space.
"How to resolve the error edge conflict or vertex conflict?"
NebulaGraph may return such errors when the Storage service receives multiple requests to insert or update the same vertex or edge within milliseconds. Try the failed requests again later.
"How to resolve the error RPC failure in MetaClient: Connection refused?"
The reason for this error is usually that the metad service status is unusual, or the network of the machine where the metad and graphd services are located is disconnected. Possible solutions are as follows:
- Check the metad service status on the server where the metad is located. If the service status is unusual, restart the metad service.
- Use
telnet meta-ip:portto check the network status under the server that returns an error.
- Check the port information in the configuration file. If the port is different from the one used when connecting, use the port in the configuration file or modify the configuration.
"How to resolve the error StorageClientBase.inl:214] Request to "x.x.x.x":9779 failed: N6apache6thrift9transport19TTransportExceptionE: Timed Out in nebula-graph.INFO?"
The reason for this error may be that the amount of data to be queried is too large, and the storaged process has timed out. Possible solutions are as follows:
- When importing data, set Compaction manually to make read faster.
- Extend the RPC connection timeout of the Graph service and the Storage service. Modify the value of
--storage_client_timeout_msin thenebula-graphd.conffile. This configuration is measured in milliseconds (ms). The default value is 60000ms.
"How to resolve the error MetaClient.cpp:65] Heartbeat failed, status:Wrong cluster! in nebula-storaged.INFO, or HBProcessor.cpp:54] Reject wrong cluster host "x.x.x.x":9771! in nebula-metad.INFO?"
The reason for this error may be that the user has modified the IP or the port information of the metad process, or the storage service has joined other clusters before. Possible solutions are as follows:
Delete the cluster.id file in the installation directory where the storage machine is deployed (the default installation directory is /usr/local/nebula), and restart the storaged service.
"How to resolve the error Storage Error: More than one request trying to add/update/delete one edge/vertex at he same time.?"
The reason for this error is that the current NebulaGraph version does not support concurrent requests to the same vertex or edge at the same time. To solve this error, re-execute your commands.
About design and functions
"How is the time spent value at the end of each return message calculated?"
Take the returned message of SHOW SPACES as an example:
nebula> SHOW SPACES;
+--------------------+
| Name               |
+--------------------+
| "basketballplayer" |
+--------------------+
Got 1 rows (time spent 1235/1934 us)
- The first number
1235shows the time spent by the database itself, that is, the time it takes for the query engine to receive a query from the client, fetch the data from the storage server, and perform a series of calculations.
- The second number
1934shows the time spent from the client's perspective, that is, the time it takes for the client from sending a request, receiving a response, and displaying the result on the screen.
"Why does the port number of the nebula-storaged process keep showing red after connecting to NebulaGraph?"
Because the nebula-storaged process waits for nebula-metad to add the current Storage service during the startup process. The Storage works after it receives the ready signal. Starting from NebulaGraph 3.0.0, the Meta service cannot directly read or write data in the Storage service that you add in the configuration file. The configuration file only registers the Storage service to the Meta service. You must run the ADD HOSTS command to enable the Meta to read and write data in the Storage service. For more information, see Manage Storage hosts.
"Why is there no line separating each row in the returned result of NebulaGraph 2.6.0?"
This is caused by the release of NebulaGraph Console 2.6.0, not the change of NebulaGraph core. And it will not affect the content of the returned data itself.
About dangling edges
A dangling edge is an edge that only connects to a single vertex and only one part of the edge connects to the vertex.
Dangling edges may appear in NebulaGraph master as the design. And there is no MERGE statements of openCypher. The guarantee for dangling edges depends entirely on the application level. For more information, see INSERT VERTEX, DELETE VERTEX, INSERT EDGE, DELETE EDGE.
"Can I set replica_factor as an even number in CREATE SPACE statements, e.g., replica_factor = 2?"
NO.
The Storage service guarantees its availability based on the Raft consensus protocol. The number of failed replicas must not exceed half of the total replica number.
When the number of machines is 1, replica_factor can only be set to1.
When there are enough machines and replica_factor=2, if one replica fails, the Storage service fails. No matter replica_factor=3 or replica_factor=4, if more than one replica fails, the Storage Service fails. To prevent unnecessary waste of resources, we recommend that you set an odd replica number.
We suggest that you set replica_factor=3 for a production environment and replica_factor=1 for a test environment. Do not use an even number.
"Is stopping or killing slow queries supported?"
Yes. For more information, see Kill query.
"Why are the query results different when using GO and MATCH to execute the same semantic query?"
The possible reasons are listed as follows.
GOstatements find the dangling edges.
RETURNcommands do not specify the sequence.
- The dense vertex truncation limitation defined by
max_edge_returned_per_vertexin the Storage service is triggered.
-
Using different types of paths may cause different query results.
GOstatements usewalk. Both vertices and edges can be repeatedly visited in graph traversal.
MATCHstatements are compatible with openCypher and usetrail. Only vertices can be repeatedly visited in graph traversal.
The example is as follows.
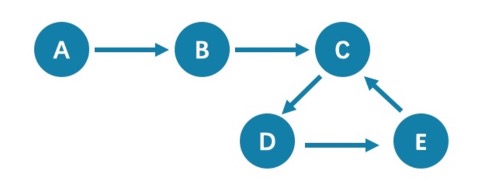
All queries that start from A with 5 hops will end at C (A->B->C->D->E->C). If it is 6 hops, the GO statement will end at D (A->B->C->D->E->C->D), because the edge C->D can be visited repeatedly. However, the MATCH statement returns empty, because edges cannot be visited repeatedly.
Therefore, using GO and MATCH to execute the same semantic query may cause different query results.
For more information, see Wikipedia.
"How to count the vertices/edges number of each tag/edge type?"
See show-stats.
"How to get all the vertices/edge of each tag/edge type?"
-
Create and rebuild the index.
> CREATE TAG INDEX IF NOT EXISTS i_player ON player(); > REBUILD TAG INDEX IF NOT EXISTS i_player; -
Use
LOOKUPorMATCH. For example:> LOOKUP ON player; > MATCH (n:player) RETURN n;
For more information, see INDEX, LOOKUP, and MATCH.
"Can non-English characters be used as identifiers, such as the names of graph spaces, tags, edge types, properties, and indexes?"
Yes, for more information, see Keywords and reserved words.
"How to get the out-degree/the in-degree of a given vertex?"
The out-degree of a vertex refers to the number of edges starting from that vertex, while the in-degree refers to the number of edges pointing to that vertex.
nebula > MATCH (s)-[e]->() WHERE id(s) == "given" RETURN count(e); #Out-degree
nebula > MATCH (s)<-[e]-() WHERE id(s) == "given" RETURN count(e); #In-degree
This is a very slow operation to get the out/in degree since no accelaration can be applied (no indices or caches). It also could be out-of-memory when hitting a supper-node.
"How to quickly get the out-degree and in-degree of all vertices?"
There is no such command.
You can use NebulaGraph Algorithm.
About operation and maintenance
"The runtime log files are too large. How to recycle the logs?"
NebulaGraph uses glog for log printing, which does not support log recycling. You can manage runtime logs by using cron jobs or the log management tool logrotate. For operational details, see Log recycling.
"How to check the NebulaGraph version?"
If the service is running: run command SHOW HOSTS META in nebula-console. See SHOW HOSTS.
If the service is not running:
Different installation methods make the method of checking the version different. The instructions are as follows:
If the service is not running, run the command ./<binary_name> --version to get the version and the Git commit IDs of the NebulaGraph binary files. For example:
$ ./nebula-graphd --version
-
If you deploy NebulaGraph with Docker Compose
Check the version of NebulaGraph deployed by Docker Compose. The method is similar to the previous method, except that you have to enter the container first. The commands are as follows:
docker exec -it nebula-docker-compose_graphd_1 bash
cd bin/
./nebula-graphd --version
-
If you install NebulaGraph with RPM/DEB package
Run
rpm -qa |grep nebulato check the version of NebulaGraph.
"How to scale my cluster up/down or out/in?"
Warning
The cluster scaling function has not been officially released in the community edition. The operations involving SUBMIT JOB BALANCE DATA REMOVE and SUBMIT JOB BALANCE DATA are experimental features in the community edition and the functionality is not stable. Before using it in the community edition, make sure to back up your data first and set enable_experimental_feature and enable_data_balance to true in the Graph configuration file.
Increase or decrease the number of Meta, Graph, or Storage nodes
-
NebulaGraph master does not provide any commands or tools to support automatic scale out/in. You can refer to the following steps:
-
Scale out and scale in metad: The metad process can not be scaled out or scale in. The process cannot be moved to a new machine. You cannot add a new metad process to the service.
Note
You can use the Meta transfer script tool to migrate Meta services. Note that the Meta-related settings in the configuration files of Storage and Graph services need to be modified correspondingly.
- Scale in graphd: Remove the IP of the graphd process from the code in the client. Close this graphd process.
- Scale out graphd: Prepare the binary and config files of the graphd process in the new host. Modify the config files and add all existing addresses of the metad processes. Then start the new graphd process.
-
Scale in storaged: See Balance remove command. After the command is finished, stop this storaged process.
Caution
- Before executing this command to migrate the data in the specified Storage node, make sure that the number of other Storage nodes is sufficient to meet the set replication factor. For example, if the replication factor is set to 3, then before executing this command, make sure that the number of other Storage nodes is greater than or equal to 3.
- If there are multiple space partitions in the Storage node to be migrated, execute this command in each space to migrate all space partitions in the Storage node.
-
Scale out storaged: Prepare the binary and config files of the storaged process in the new host, modify the config files and add all existing addresses of the metad processes. Then register the storaged process to the metad, and then start the new storaged process. For details, see Register storaged services.
You also need to run Balance Data and Balance leader after scaling in/out storaged.
-
Add or remove disks in the Storage nodes
Currently, Storage cannot dynamically recognize new added disks. You can add or remove disks in the Storage nodes of the distributed cluster by following these steps:
-
Execute
SUBMIT JOB BALANCE DATA REMOVE <ip:port>to migrate data in the Storage node with the disk to be added or removed to other Storage nodes.Caution
- Before executing this command to migrate the data in the specified Storage node, make sure that the number of other Storage nodes is sufficient to meet the set replication factor. For example, if the replication factor is set to 3, then before executing this command, make sure that the number of other Storage nodes is greater than or equal to 3.
- If there are multiple space partitions in the Storage node to be migrated, execute this command in each space to migrate all space partitions in the Storage node.
-
Execute
DROP HOSTS <ip:port>to remove the Storage node with the disk to be added or removed. -
In the configuration file of all Storage nodes, configure the path of the new disk to be added or removed through
--data_path, see Storage configuration file for details. - Execute
ADD HOSTS <ip:port>to re-add the Storage node with the disk to be added or removed. - As needed, execute
SUBMIT JOB BALANCE DATAto evenly distribute the shards of the current space to all Storage nodes and executeSUBMIT JOB BALANCE LEADERcommand to balance the leaders in all spaces. Before running the command, select a space.
"After changing the name of the host, the old one keeps displaying OFFLINE. What should I do?"
Hosts with the status of OFFLINE will be automatically deleted after one day.
"How do I view the dmp file?"
The dmp file is an error report file detailing the exit of the process and can be viewed with the gdb utility. the Coredump file is saved in the directory of the startup binary (by default it is /usr/local/nebula) and is generated automatically when the NebulaGraph service crashes.
- Check the Core file process name, pid is usually a numeric value.
$ file core.<pid> - Use gdb to debug.
$ gdb <process.name> core.<pid> - View the contents of the file.
$(gdb) bt
For example:
$ file core.1316027
core.1316027: ELF 64-bit LSB core file, x86-64, version 1 (SYSV), SVR4-style, from '/home/workspace/fork/nebula-debug/bin/nebula-metad --flagfile /home/k', real uid: 1008, effective uid: 1008, real gid: 1008, effective gid: 1008, execfn: '/home/workspace/fork/nebula-debug/bin/nebula-metad', platform: 'x86_64'

$ gdb /home/workspace/fork/nebula-debug/bin/nebula-metad core.1316027

$(gdb) bt
#0  0x00007f9de58fecf5 in __memcpy_ssse3_back () from /lib64/libc.so.6
#1  0x0000000000eb2299 in void std::__cxx11::basic_string<char, std::char_traits<char>, std::allocator<char> >::_M_construct<char*>(char*, char*, std::forward_iterator_tag) ()
#2  0x0000000000ef71a7 in nebula::meta::cpp2::QueryDesc::QueryDesc(nebula::meta::cpp2::QueryDesc const&) ()
...
If you are not clear about the information that dmp prints out, you can post the printout with the OS version, hardware configuration, error logs before and after the Core file was created and actions that may have caused the error on the NebulaGraph forum.
How can I set the NebulaGraph service to start automatically on boot via systemctl?
-
Execute
systemctl enableto start the metad, graphd and storaged services.[root]# systemctl enable nebula-metad.service Created symlink from /etc/systemd/system/multi-user.target.wants/nebula-metad.service to /usr/lib/systemd/system/nebula-metad.service. [root]# systemctl enable nebula-graphd.service Created symlink from /etc/systemd/system/multi-user.target.wants/nebula-graphd.service to /usr/lib/systemd/system/nebula-graphd.service. [root]# systemctl enable nebula-storaged.service Created symlink from /etc/systemd/system/multi-user.target.wants/nebula-storaged.service to /usr/lib/systemd/system/nebula-storaged.service. -
Configure the service files for metad, graphd and storaged to set the service to pull up automatically.
Caution
The following points need to be noted when configuring the service file. - The paths of the PIDFile, ExecStart, ExecReload and ExecStop parameters need to be the same as those on the server. - RestartSec is the length of time (in seconds) to wait before restarting, which can be modified according to the actual situation. - (Optional) StartLimitInterval is the unlimited restart, the default is 10 seconds if the restart exceeds 5 times, and set to 0 means unlimited restart. - (Optional) LimitNOFILE is the maximum number of open files for the service, the default is 1024 and can be changed according to the actual situation.
Configure the service file for the metad service.
$ vi /usr/lib/systemd/system/nebula-metad.service

[Unit]
Description=Nebula Graph Metad Service
After=network.target

[Service ]
Type=forking
Restart=always
RestartSec=15s
PIDFile=/usr/local/nebula/pids/nebula-metad.pid
ExecStart=/usr/local/nebula/scripts/nebula.service start metad
ExecReload=/usr/local/nebula/scripts/nebula.service restart metad
ExecStop=/usr/local/nebula/scripts/nebula.service stop metad
PrivateTmp=true
StartLimitInterval=0
LimitNOFILE=1024

[Install]
WantedBy=multi-user.target
Configure the service file for the graphd service.
Configure the service file for the storaged service.$ vi /usr/lib/systemd/system/nebula-graphd.service [Unit] Description=Nebula Graph Graphd Service After=network.target [Service] Type=forking Restart=always RestartSec=15s PIDFile=/usr/local/nebula/pids/nebula-graphd.pid ExecStart=/usr/local/nebula/scripts/nebula.service start graphd ExecReload=/usr/local/nebula/scripts/nebula.service restart graphd ExecStop=/usr/local/nebula/scripts/nebula.service stop graphd PrivateTmp=true StartLimitInterval=0 LimitNOFILE=1024 [Install] WantedBy=multi-user.target$ vi /usr/lib/systemd/system/nebula-storaged.service [Unit] Description=Nebula Graph Storaged Service After=network.target [Service] Type=forking Restart=always RestartSec=15s PIDFile=/usr/local/nebula/pids/nebula-storaged.pid ExecStart=/usr/local/nebula/scripts/nebula.service start storaged ExecReload=/usr/local/nebula/scripts/nebula.service restart storaged ExecStop=/usr/local/nebula/scripts/nebula.service stop storaged PrivateTmp=true StartLimitInterval=0 LimitNOFILE=1024 [Install] WantedBy=multi-user.target -
Reload the configuration file.
[root]# sudo systemctl daemon-reload -
Restart the service.
$ systemctl restart nebula-metad.service
$ systemctl restart nebula-graphd.service
$ systemctl restart nebula-storaged.service
About connections
"Which ports should be opened on the firewalls?"
If you have not modified the predefined ports in the Configurations, open the following ports for the NebulaGraph services:
| Service | Port |
|---|---|
| Meta | 9559, 9560, 19559 |
| Graph | 9669, 19669 |
| Storage | 9777 ~ 9780, 19779 |
If you have customized the configuration files and changed the predefined ports, find the port numbers in your configuration files and open them on the firewalls.
For more port information, see Port Guide for Company Products.
"How to test whether a port is open or closed?"
You can use telnet as follows to check for port status.
telnet <ip> <port>
Note
If you cannot use the telnet command, check if telnet is installed or enabled on your host.
For example:
// If the port is open:
$ telnet 192.168.1.10 9669
Trying 192.168.1.10...
Connected to 192.168.1.10.
Escape character is '^]'.

// If the port is closed or blocked:
$ telnet 192.168.1.10 9777
Trying 192.168.1.10...
telnet: connect to address 192.168.1.10: Connection refused