Canvas overview
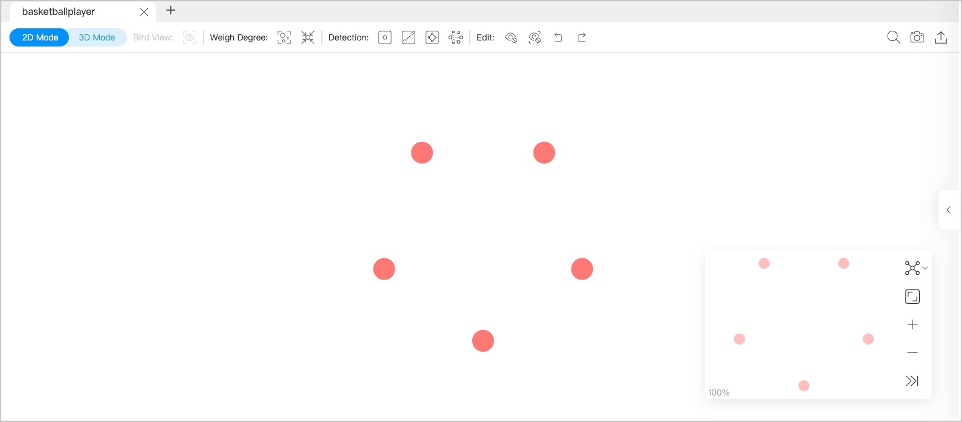
You can visually explore data on a canvas. This topic introduces the composition of a canvas and its related functions.
Canvas overview diagram:
Tabs on the Top
Click the plus sign  to add a new canvas. You can have operations on multiple canvases simultaneously.

- Canvas data on different canvases can come from the same graph space or from different graph spaces.
- You can customize the name of a canvas except for the canvas in the left-most tab.
Visualization modes
Graph data can be visually explored in 2D mode and 3D mode. For more information, Visualization modes.
Data storage
Graph data on the current canvas can be stored by creating snapshots or exporting canvas data as images or CSV files.
At the top right of the page, you can:
- Click
 to create a snapshot. For more information, see Canvas snapshots.
- Click
 and then click Export CSV File to store canvas data as CSV files.
- Click and then click Export PNG File to store canvas data as images.
Search box
In the search box at the top left of the page, click  and enter a VID or the property values of tags to locate target vertices.
Layouts
Explorer provides 6 layouts to show the relationship between the data on a canvas.
| Force | Dagre | Circular | Grid | Neural Network | Radial |
|---|---|---|---|---|---|
 |
 |
 |
 |
 |
 |
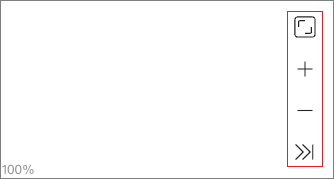
Minimap
You can display the vertices on a canvas on full screen. You can also collapse the minimap, zoom in or zoom out the canvass, etc. The percentage of a canvas graph to the total is displayed in the lower-left corner of the minimap.
Data overview
On the right side of the page, click  to expand the data overview panel.
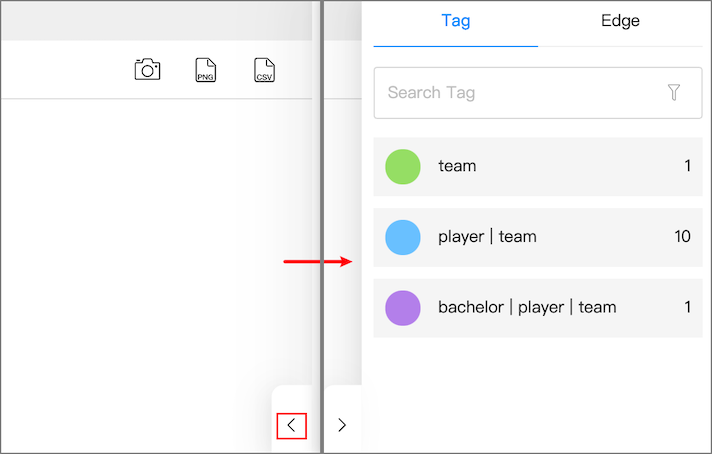
On the data overview panel, you are enabled to:
- See the number of tags and edge types, and the number of the corresponding vertices and edges on a canvas.
-
Click the color icon of the tags or edge types to customize the color and size. You can also customize the icons and images of the tags.
Note
You can only change colors in batches in the data overview panel. Right-click a single vertex on a canvas to manually modify the style of the vertex.
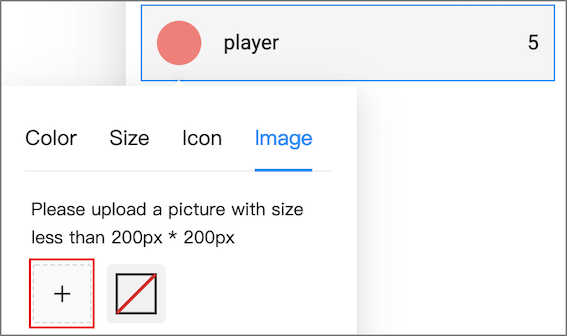
-
Upload images to personalize the style of the vertices in the canvas, and the uploaded images are stored in the browser. To store uploaded images permanently, save the canvas data as a snapshot. For details, see Manage snapshots.
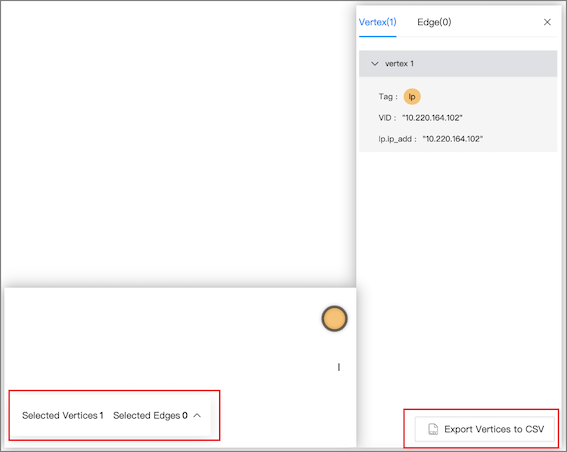
Select vertices and edges on the canvas, and then click Selected Vertices {number} Selected Edges {number} in the lower left corner to view the detailed information of the vertices and edges. You can export the data as a CSV file.