Cluster Diagnositics
The cluster diagnostics feature in Dashboard Enterprise Edition is to locate and analyze the current cluster problems within a specified time range and summarize the diagnostic results and cluster monitoring information to web-based diagnostic reports.
Features
- Diagnostic reports allow you to troubleshoot the current cluster problems within a specified time range.
- Quickly understand the basic information of the nodes, services, service configurations, and query sessions in the cluster.
- Based on the diagnostic reports, you can make operation and maintenance recommendations and cluster alerts.
Entry
- In the top navigation bar of the Dashboard Enterprise Edition page, click Cluster Management.
- On the right side of the target cluster, click Detail.
- In the left navigation bar, click Information->Cluster Diagnostics.
Create diagnostic reports
-
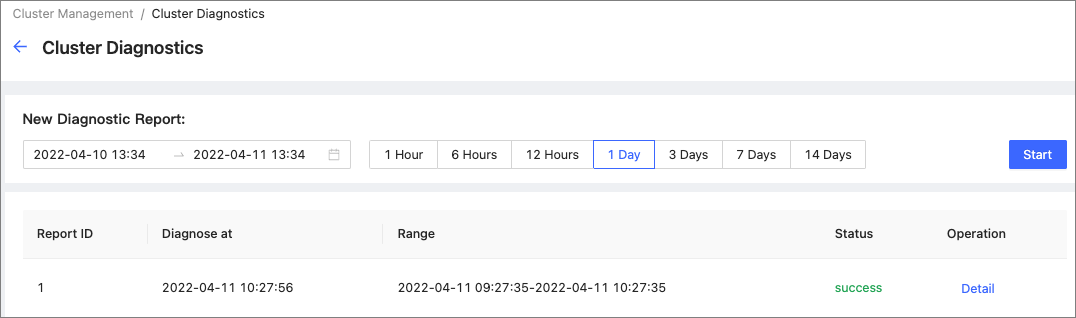
Select a time range for diagnostics. You can customize the time range or set the range by selecting time intervals, including
1 Hour,6 Hours,12 Hours,1 Day,3 Days,7 Days, and14 Days.Caution
Note that the end time of the diagnostic range you set cannot be longer than the current time. If the end time is longer than the current time, the end time will be set to the current time.
-
On the Cluster Diagnostics page, click Start.
-
Wait for the diagnostic report to be generated. When the diagnostic status is changed to success from generating, the diagnostic report is ready.
View diagnostic reports
In the diagnostic report list, you can view the diagnostic reports by clicking Detail on the right side of the target report.
A diagnostic report contains the following information:
- Diagnosis Result
- Basic Info
- Load Info
- Network
- Session
- Service Info
- Configuration Info
Diagnosis Result
-
When the following parameters are abnormal, the corresponding information is displayed in the Diagnosis Result section, including the parameter name, type, severity, and details.
Parameter Description num_queries_hit_memory_watermarkThe total number of nGQL statements that reach the memory high-water mark during execution. graphd_downGraph services stopped running. storaged_downStorage services stopped running. metad_downMeta services stopped running. node-exporter downThe service used to collect data from the node stopped running.
- When no abnormality is diagnosed, no diagnostic information is displayed in the diagnostic result.
Basic Info
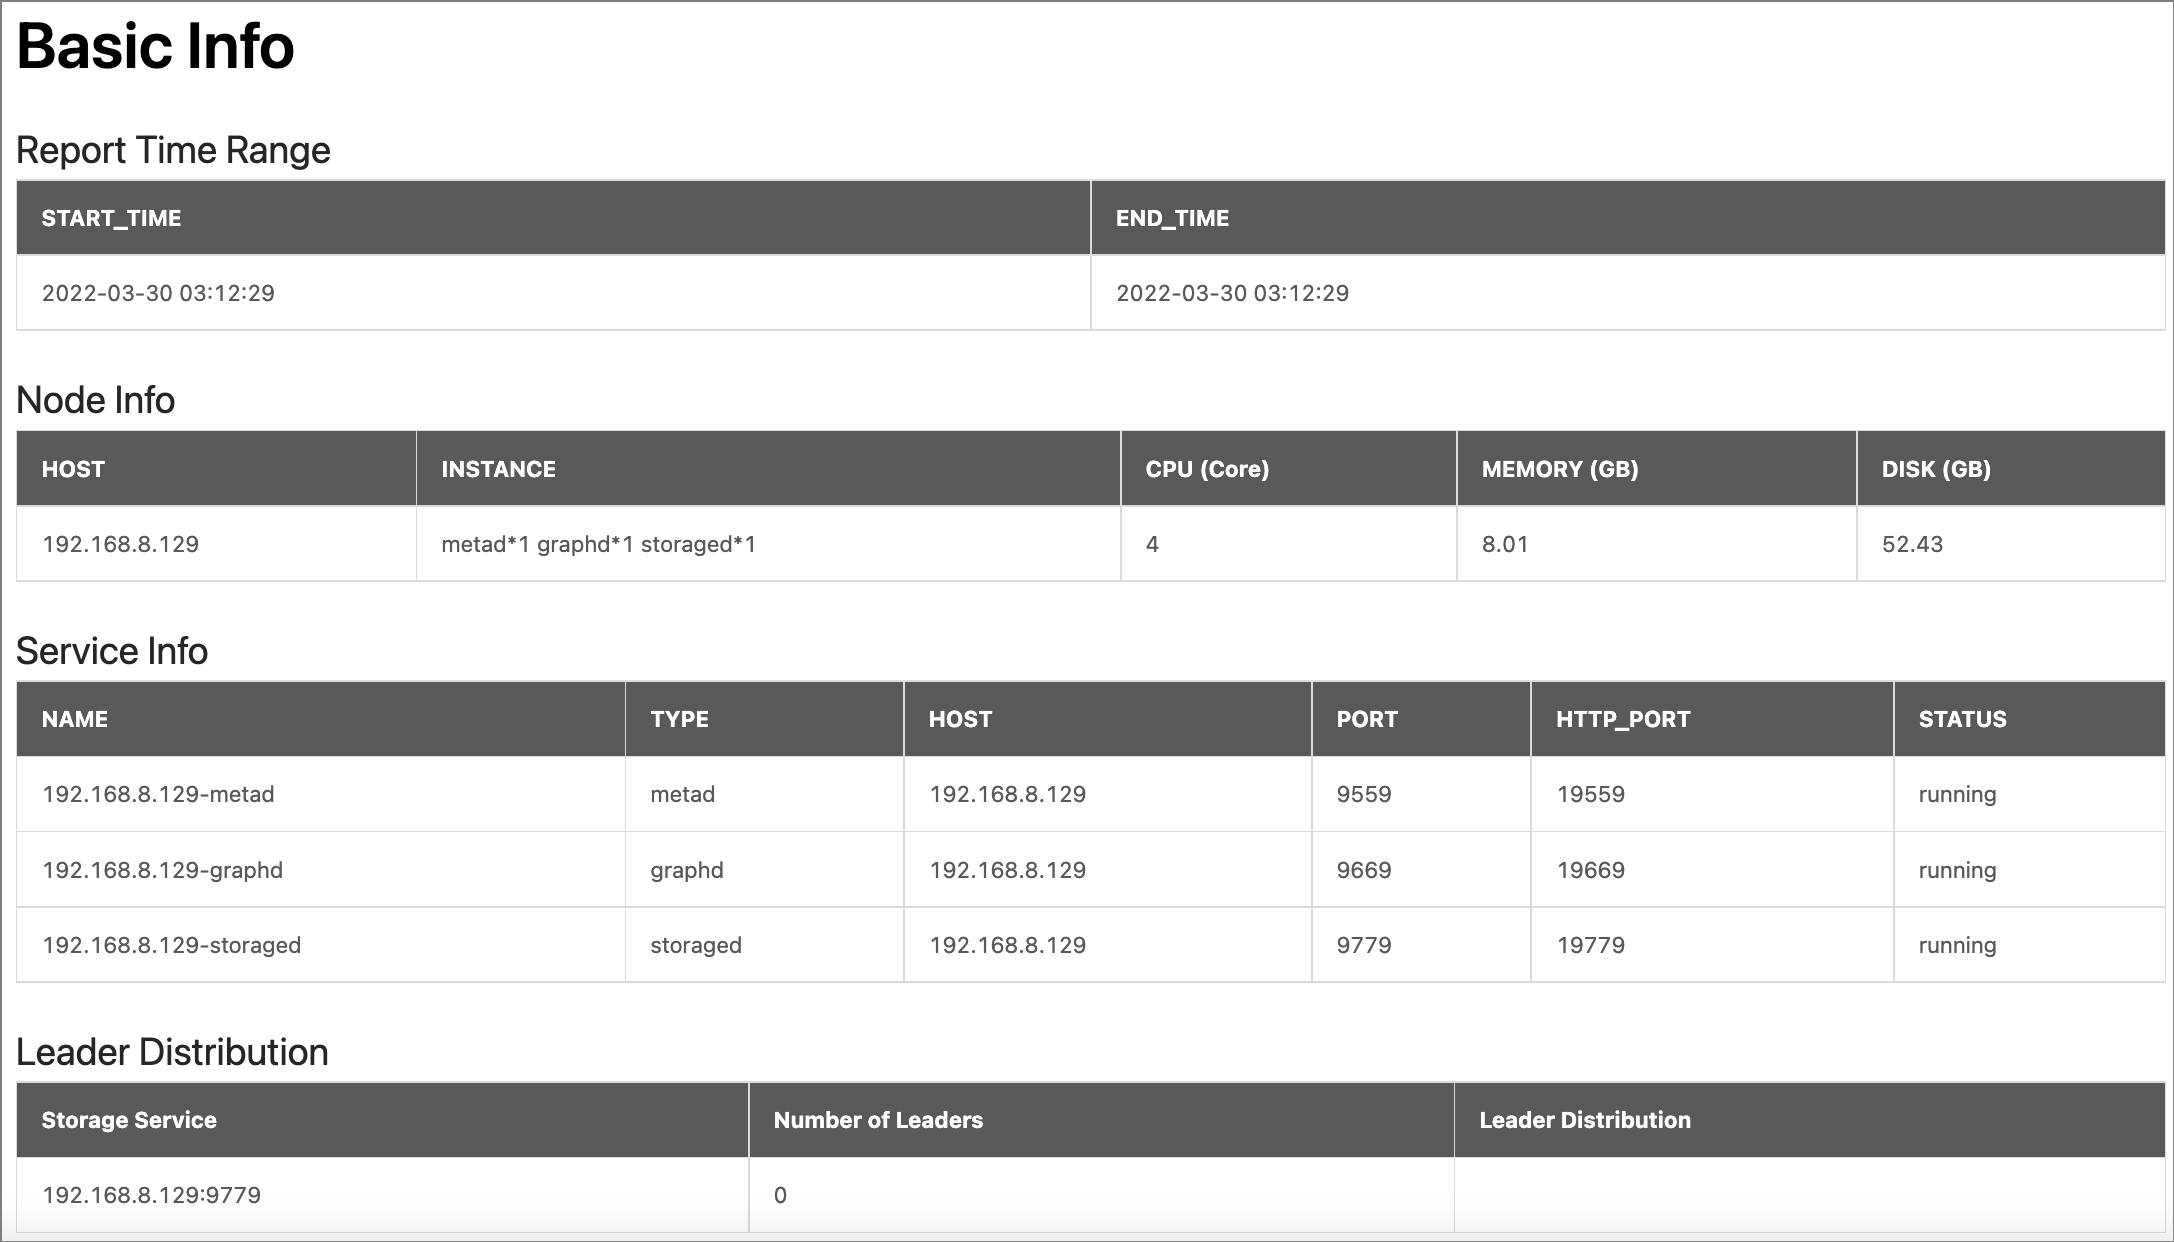
- Report Time Range: Displays the time range of the diagnostic report.
-
Node Info: Displays the basic information of the node, including the node IP, number of services, CPU, memory, and disk.
Parameter Description HOSTThe IP address of the node. INSTANCEThe number of NebulaGraph services deployed on this node. Such as: metad*1 graphd*1 storaged*1.CPUThe number of CPU cores. Unit: Core. MEMORYThe memory size of the node. Unit: GB. DISKThe disk size of the node. Unit: GB.
- Service Info: Displays the type, node IP, HTTP port, and operational status of each NebulaGraph service.
-
Leader Distribution: Displays the distribution of Leaders in Storage services.
Parameter Description Storage ServiceDisplays the access addresses for Storage services. Number of LeadersDisplays the number of Leaders in the corresponding Storage service. Leader DistributionDisplays the number of Leader distributions for different space graphs in the corresponding Storage service.
Load Info
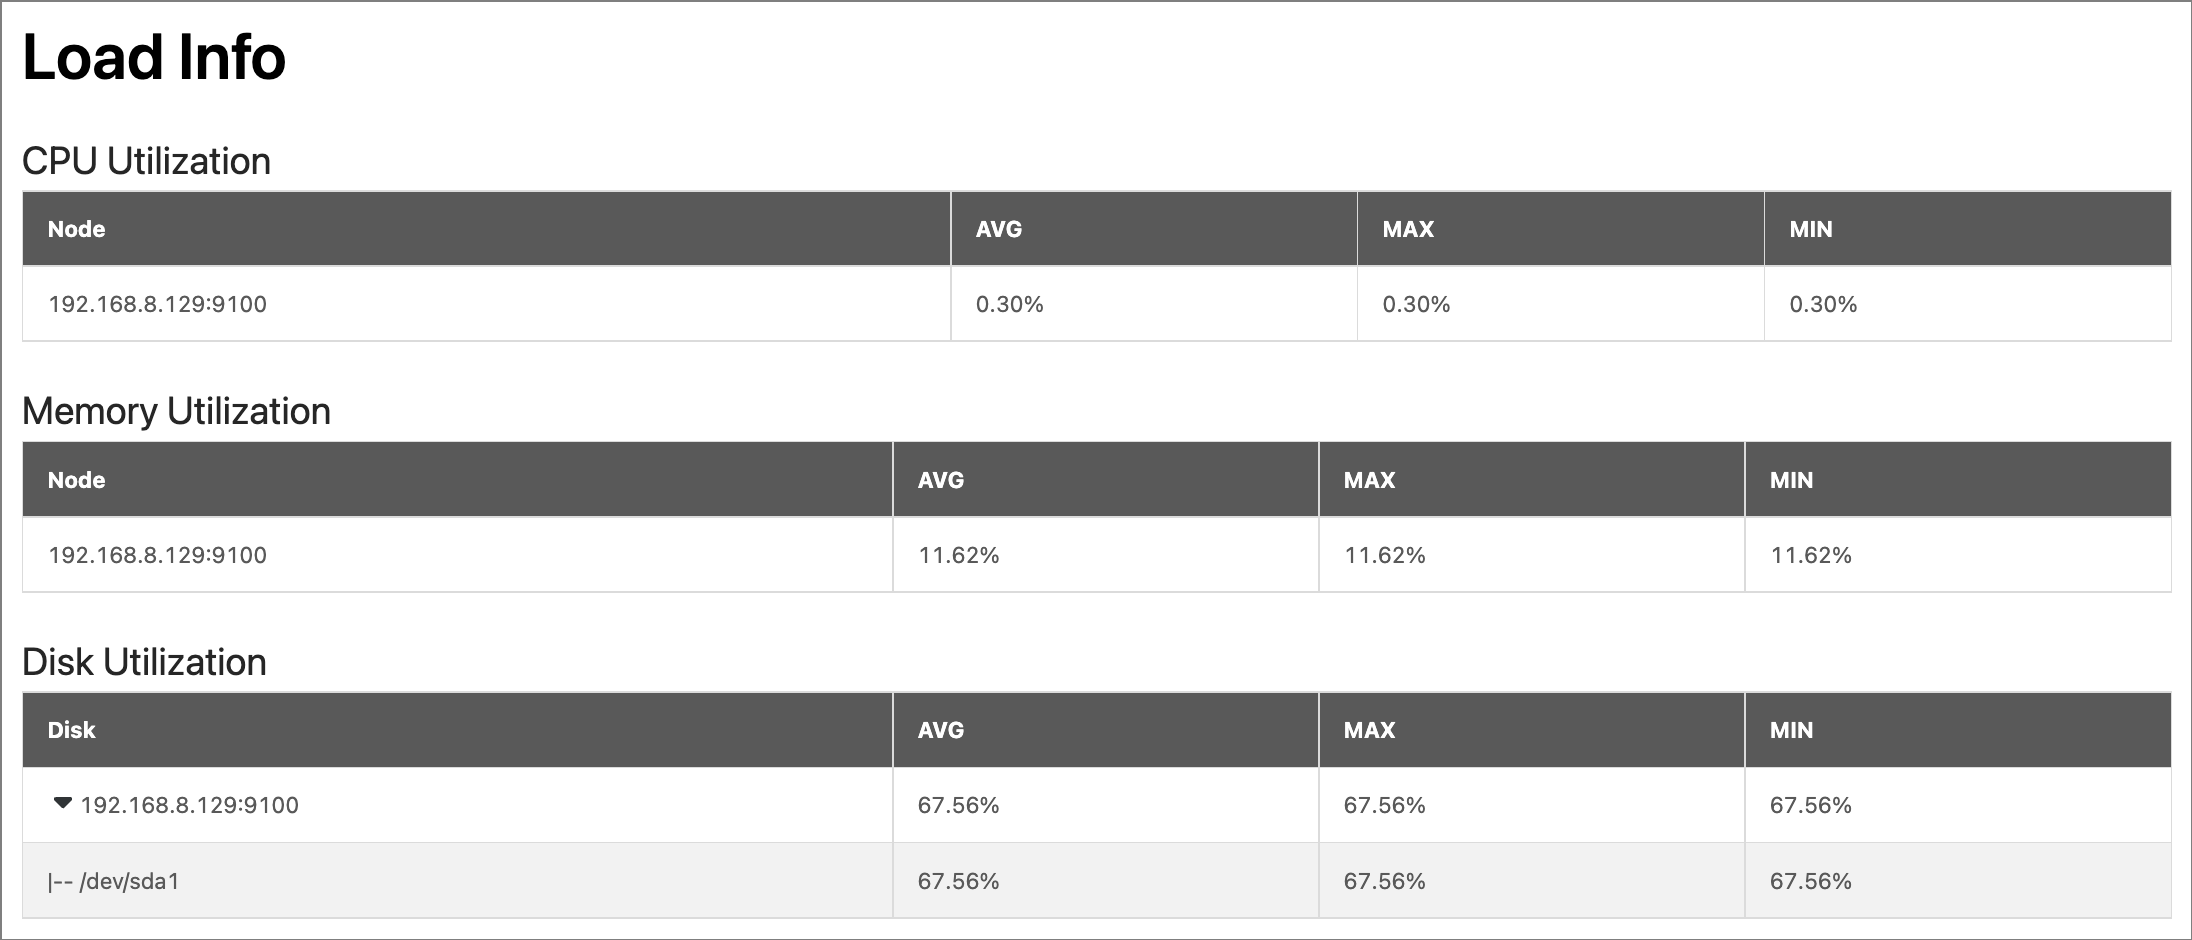
Displays the load information of the node, including the average value (AVG), maximum value (MAX), minimum value (MIN) of the following metrics of the node within the time range:
- Memory Utilization: Displays the node memory usage in %.
- CPU Utilization: Displays the node CPU usage in %.
- Disk Utilization: Displays the total disk utilization of the node and the utilization of each disk in the node in %.
Network
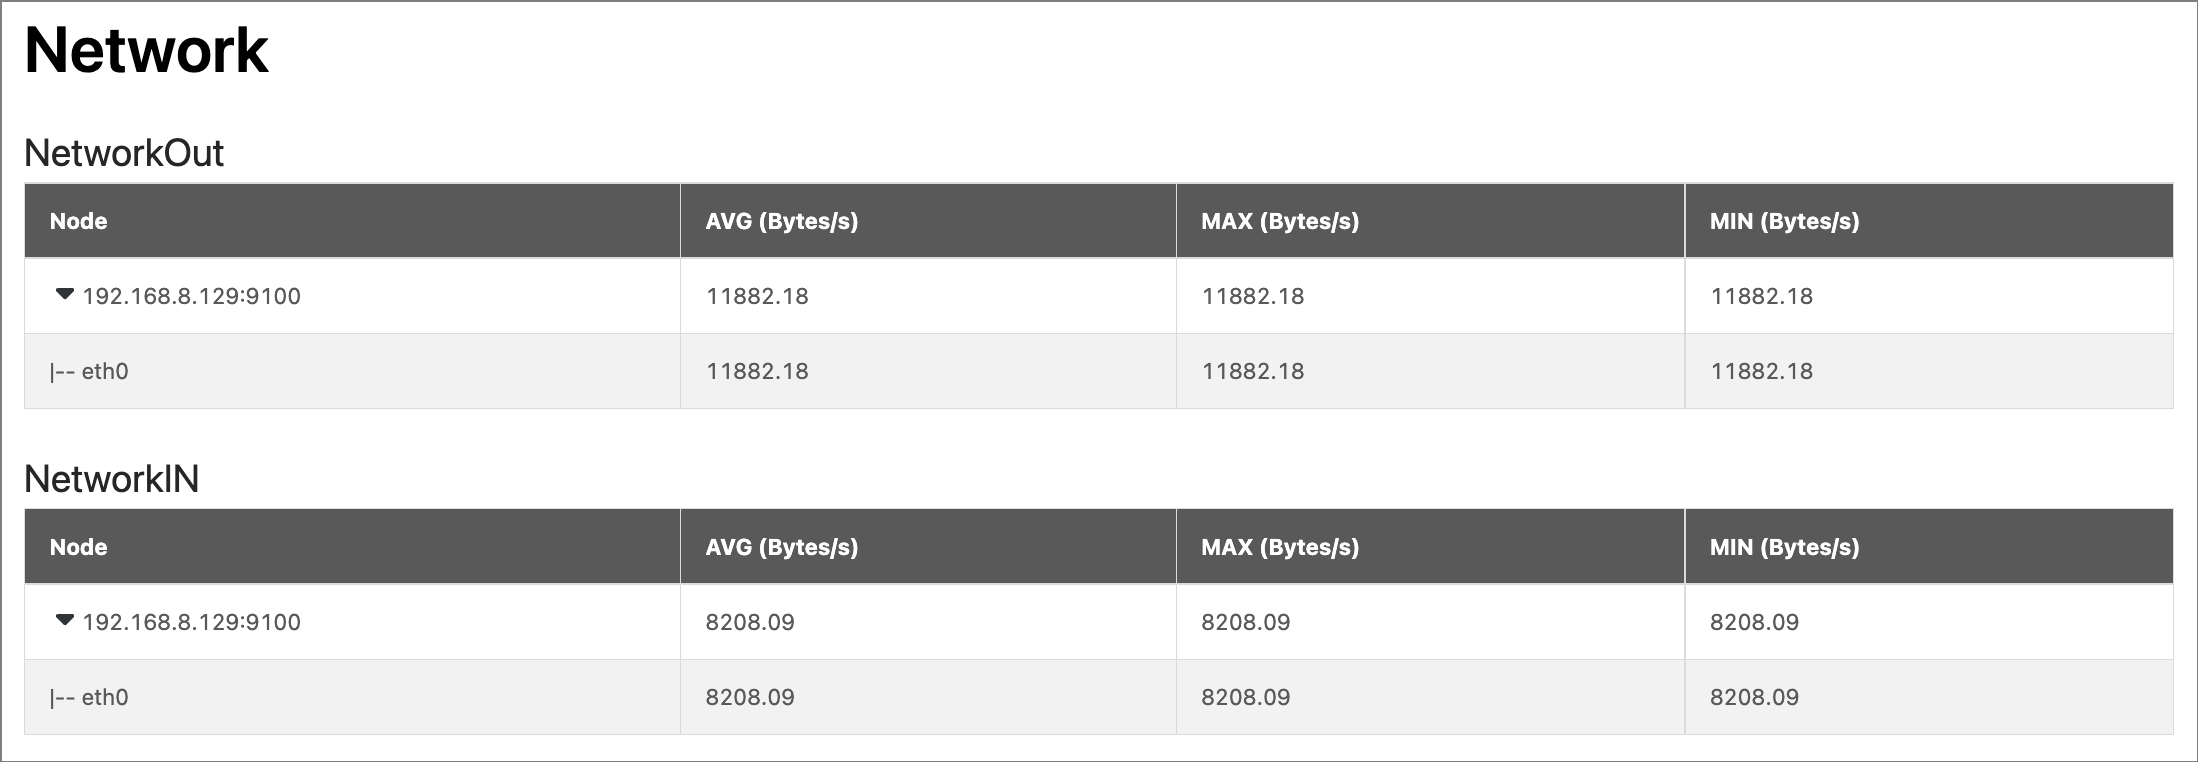
Displays the network traffic information of all nodes in the cluster, including the average (AVG), maximum (MAX), and minimum (MIN) values of the following metrics:
- NetworkOut: Displays the magnitude of network outflow speed for each node in the cluster, and the magnitude of outflow speed for each NIC in each node. Unit: Bytes/s.
- NetworkIn: Shows the magnitude of network inflow speed for each server node in the cluster and the magnitude of inflow speed for each NIC in each node. Unit: Bytes/s.
Session
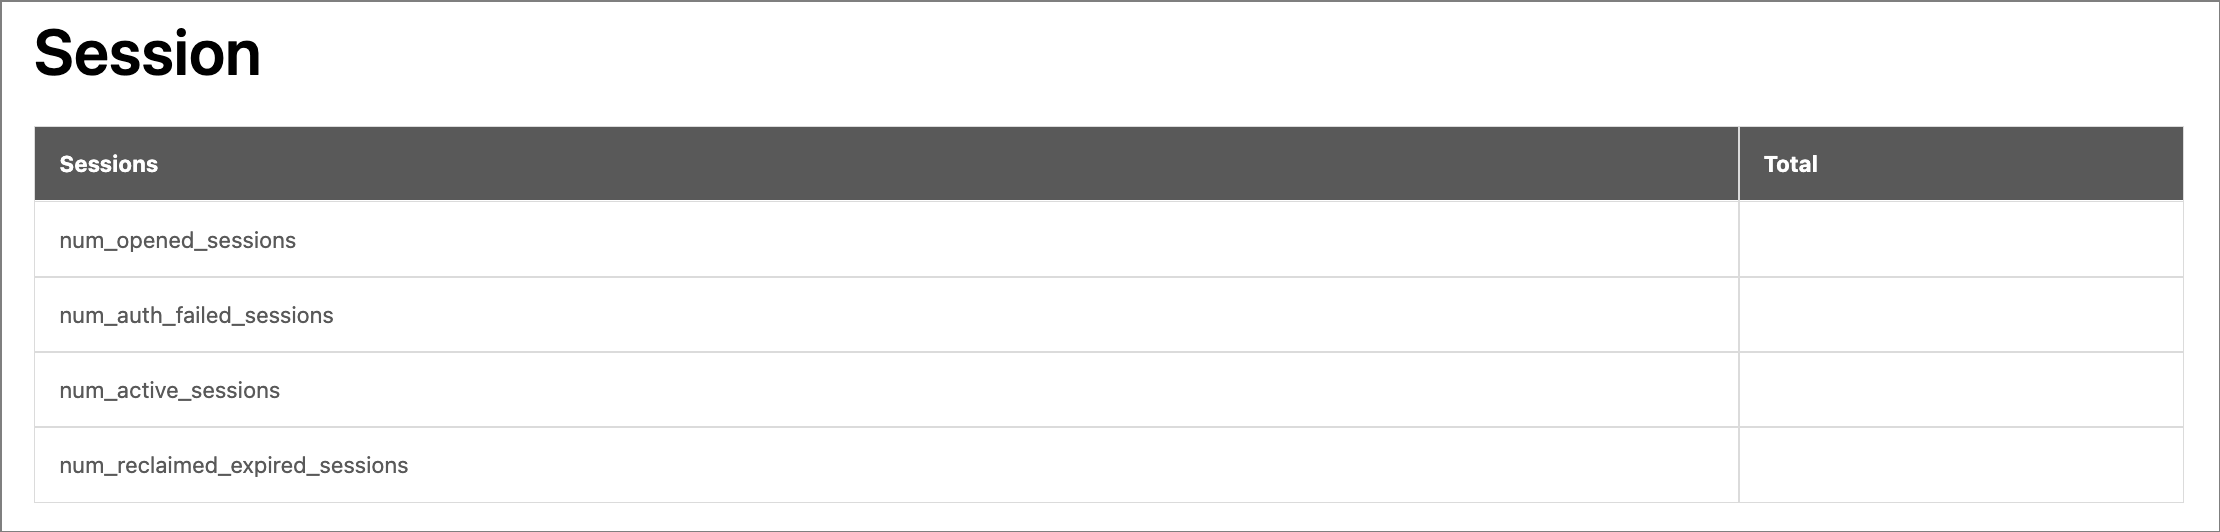
Displays the session-related information for all Graph services in the cluster.
| Parameter | Description |
|---|---|
num_opened_sessions |
The number of sessions connected to the server. |
num_auth_failed_sessions |
The number of sessions in which login authentication failed. |
num_active_sessions |
The number of currently active sessions. |
num_reclaimed_expired_sessions |
The number of expired sessions actively reclaimed by the server. |
Service Info
Displays metrics related to the stability of each service in the cluster.
-
Graph:
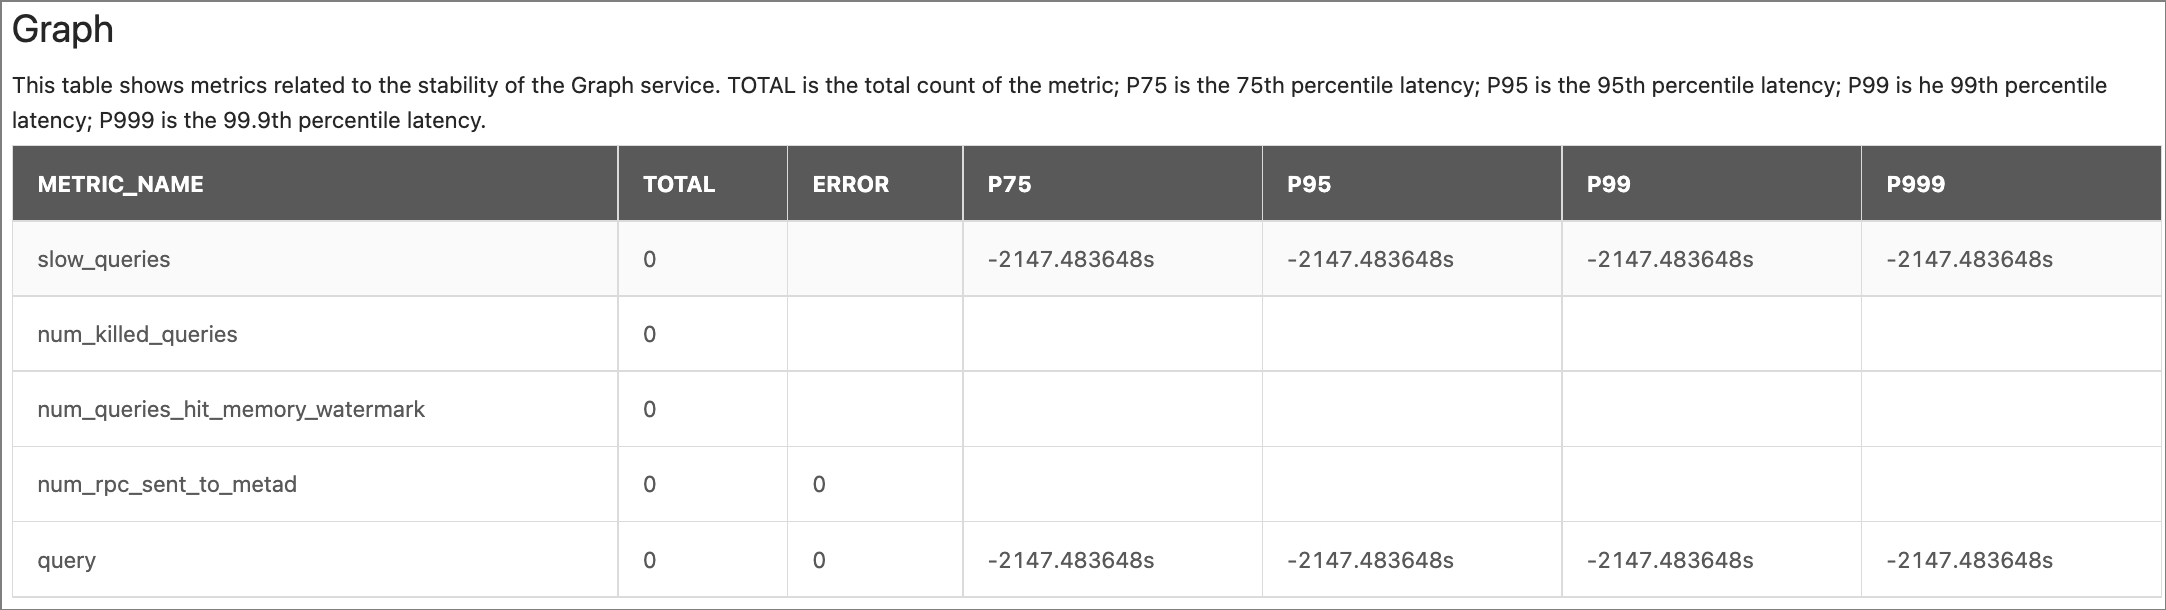
Parameter Description METRIC_NAMEquery: The number of all queries.
slow_queries: The number of slow queries.num_killed_queries: The number of killed queries.num_queries_hit_memory_watermark: The total number of nGQL statements that reach the memory high-water mark during execution.num_rpc_sent_to_metad: The number of RPC requests that the Graphd service sent to the Metad service.
-
Meta:
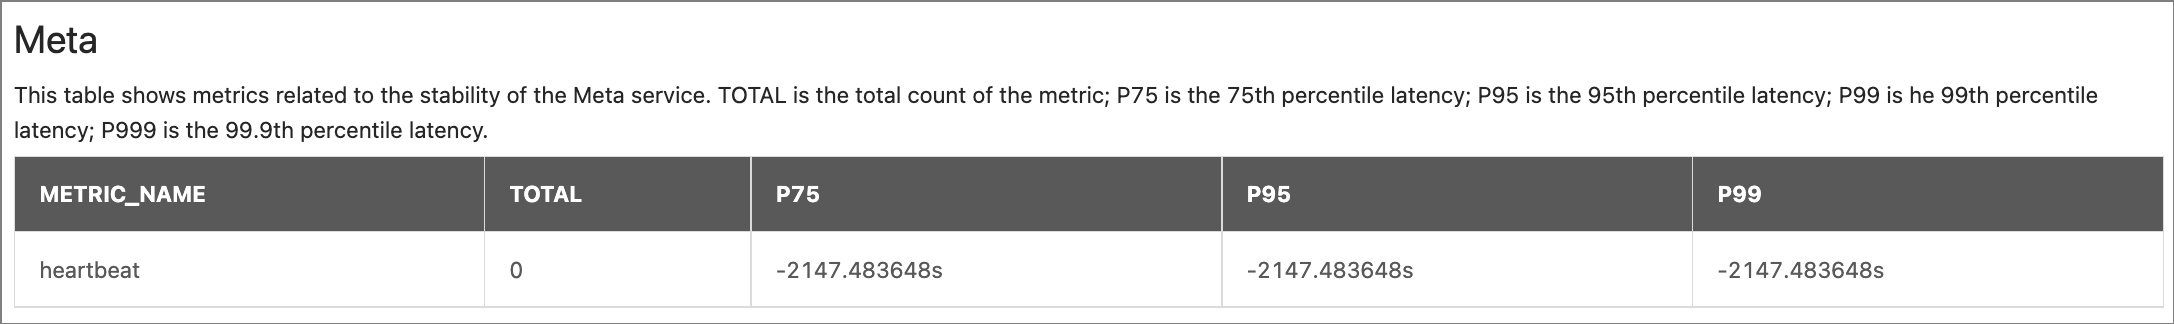
Parameter Description METRIC_NAMEheartbeat: The number of heartbeats.
-
Storage:
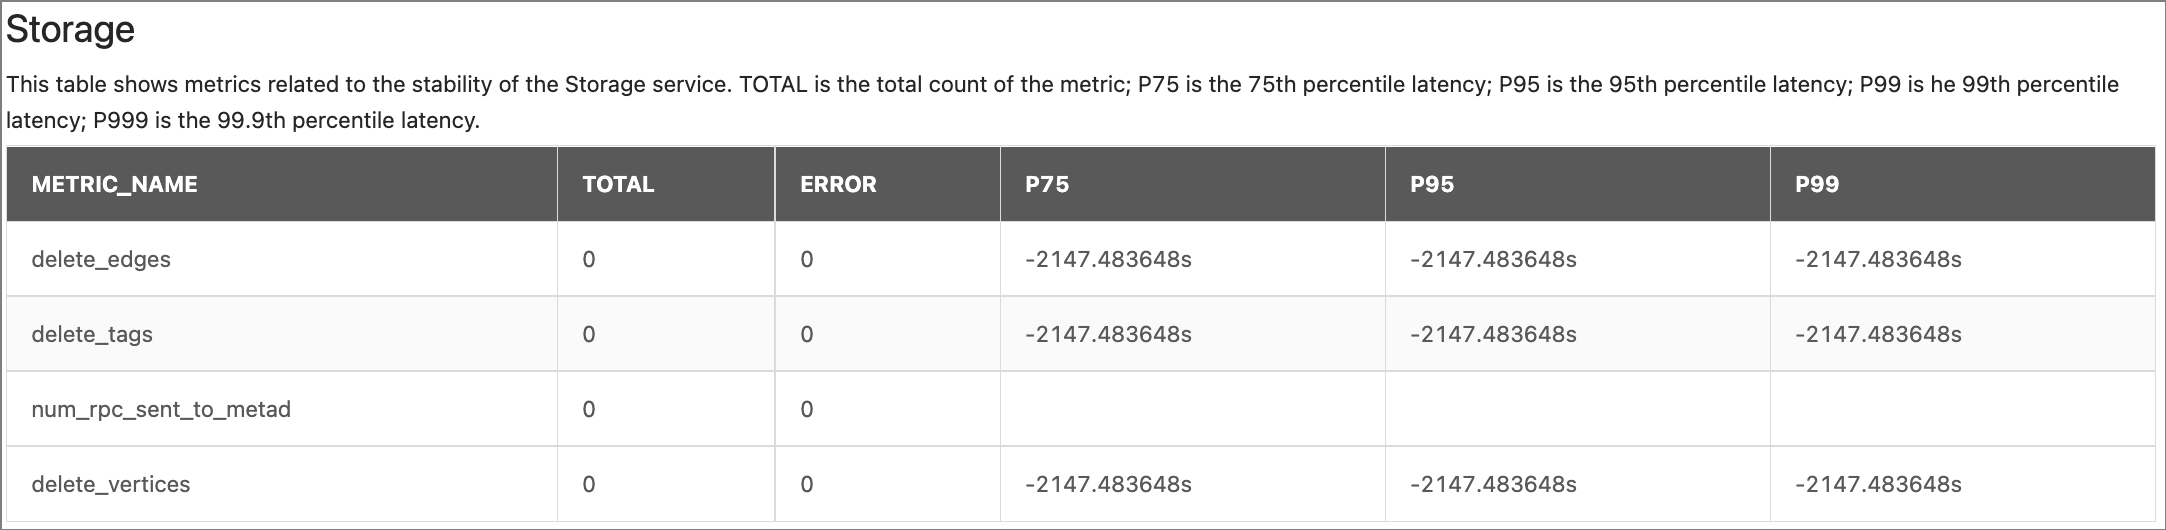
Parameter Description METRIC_NAMEdelete_vertices: The number of deleted vertices.
delete_edges: The number of deleted edges.delete_tags: The number of deleted tags.num_rpc_sent_to_metad: The number of RPC requests that the Storaged service sent to the Metad service.
The descriptions of other parameters are as follows:
| Parameter | Description |
|---|---|
TOTAL |
The total number of times this monitoring metric is executed. |
ERROR |
The number of errors that occurred. |
P75 |
The 75th percentile latency. |
P95 |
The 95th percentile latency. |
P99 |
The 99th percentile latency. |
P999 |
The 99.9th percentile latency. |
Configuration Info
Lists all configuration information for Graph, Meta, and Storage services in the current cluster.
For information about the configurations of each service in NebulaGraph, see Configurations.