Deploy Dashboard Enterprise Edition
This topic will introduce how to deploy Dashboard Enterprise Edition in detail.
Prerequisites
Before deploying Dashboard Enterprise Edition, you must do a check of these:
- Select and download Dashboard Enterprise Edition of the correct version. For information about the version correspondence between Dashboard Enterprise Edition and NebulaGraph, see Version compatibility.
-
MySQL and SQLite are supported to store Dashboard metadata. To use MySQL, make sure that the environment of MySQL is ready and a MySQL database named as
dashboardis create. Make sure the default character set of the database isutf8.Note
No SQLite environment is required when using SQLite to store Dashboard metadata.
-
Before the installation starts, the following ports are not occupied.
Port Description 7005 The port through which Dashboard Enterprise Edition provides the web service. 9090 The port of the prometheus service. 9200 The port of the nebula-stats-exporter service. 9093 The port of the Alertmanager service, used to receive Prometheus alerts and then send them to Dashboard. 9100 The port of the node-exporter service. The node-exporter is aumatically deployed on the target machine after a cluster is created or imported. It is used to collect the source information of machines in the cluster, including the CPU, memory, load, disk, and network.
-
The license is ready.
Enterpriseonly
The license is only available in the Enterprise Edition. To obtain the license, apply for Nebula Dashboard Free Trial.
Deploy Dashboard Enterprise Edition with TAR
Installation
-
Select and download the TAR package according to your needs. It is recommended to select the latest version.
Enterpriseonly
You can apply online for Dashboard Enterprise Edition free trial. To purchase, contact our sales team via email (inquiry@vesoft.com). For features of Dashboard Enterprise Edition, see Pricing.
-
Use
tar -xzvfto decompress the TAR package.tar -xzvf nebula-dashboard-ent-<version>.linux-amd64.tar.gz -C <install_path>For example:
tar -xzvf nebula-dashboard-ent-3.1.0.linux-amd64.tar.gz -C /usr/local/ -
Edit
vim /usr/local/nebula-dashboard-ent/config/config.yamlto modify the configuration.server: host: 0.0.0.0 # Specifies the address segment that can access Dashboard. port: 7005 # The default port used to access Dashboard Enterprise Edition. certFile: "" # The local device certificate path for accessing Dashboard via HTTPS. keyFile: "" # The local device certificate key path for accessing Dashboard via HTTPS. database: dialect: sqlite # The database type used to store metadata. Only support SQLite and MySQL currently. The default value is SQLite. autoMigrate: true # Whether to automatically create a database table. Defaults to true. # SQLite-related configurations, configured only when dialect is set to sqlite. sqliteFilePath: data/dashboard.sqlite.db # The default path for storing information in SQLite. # MySQL-related configurations, configured only when dialect is set to mysql. host: 192.168.8.157 # The IP address of the connected MySQL database. port: 3306 # The port of the connected MySQL database. username: root # The username to log in MySQL. password: nebula # The password to log in MySQL. name: dashboard # The name of the corresponding database. autoMigrate: true # Auto database tables creation, the default value of which is true. # Information about the exporter port exporter: nodePort: 9100 # The port of the node-exporter service. nebulaPort: 9200 # The port of the nebula-stats-exporter service. # Information of services proxy: prometheus: target: "127.0.0.1:9090" # The IP address and port of the prometheus service. alertmanager: target: "127.0.0.1:9093" # The IP address and port of the Alertmanager service. # Information of the sender's Email used to invite LDAP accounts. mail: host: smtp.office365.com # The SMTP server address. port: 587 # The port number of the SMTP server. username: "" # The SMTP server account name. password: "" # The SMTP server password. # System information system: webAddress: http://127.0.0.1:7005 # The external access for Dashboard. It can be set as a hostname, used for interface callbacks. For example, the invitee who is invited by mail can use this link to access Dashboard. messageStore: 90 # It sets the number of days to keep alert messages, the value of which is 90 by default. # LDAP information ldap: server: ldap://127.0.0.1 # The LDAP server address. bindDN: cn=admin,dc=vesoft,dc=com # The LDAP login username. bindPassword: "" # The LDAP login password. baseDN: dc=vesoft,dc=com # Set the path to query user data. userFilter: "&(objectClass=*)" # Set a filter to LDAP search queries. emailKey: mail # Set the field name used to restore email in LDAP. ... # BR br: backupLogsDir: "logs/br/backupLogsDir" restoreLogsDir: "logs/br/restoreLogsDir" -
Copy the license file to the
nebula-dashboard-entdirectory.cp -r <license> <dashboard_path>For example:
cp -r nebula.license /usr/local/nebula-dashboard-ent -
Start Dashboard.
You can use the following command to start the Dashboard with one click.
cd /usr/local/nebula-dashboard-ent/scripts
sudo ./dashboard.service start all
Or execute the following commands to start prometheus, webserver, nebula-stats-exporter and alertmanager services to start Dashboard.
cd scripts
sudo ./dashboard.service start prometheus # Start prometheus service
sudo ./dashboard.service start webserver # Start webserver service
sudo ./dashboard.service start exporter # Start nebula-stats-exporter service
sudo ./dashboard.service start alertmanager # Start alertmanager service
Note
If you change the configuration file after starting Dashboard, you can run dashboard.service restart all in the scripts directory to synchronize the changes to the Dashboard client page.
Manage Dashboard Service
You can use the dashboard.service script to start, stop, and check the Dashboard services.
sudo <dashboard_path>/dashboard/scripts/dashboard.service
[-v] [-h]
<start|stop|status>  <prometheus|webserver|exporter|gateway|all>
| Parameter | Description |
|---|---|
dashboard_path |
Dashboard installation path. |
-v |
Display detailed debugging information. |
-h |
Display help information. |
start |
Start the target services. |
stop |
Stop the target services. |
status |
Check the status of the target services. |
prometheus |
Set the prometheus Service as the target service. |
webserver |
Set the webserver Service as the target service. |
exporter |
Set the exporter Service as the target service. |
gateway |
Set the gateway Service as the target service. |
all |
Set all the Dashboard services as the target services. |
Examples
Dashboard is installed in the current directory, and you can use the following commands to manage services.
sudo /dashboard/scripts/dashboard.service start all #Start Dashboard.
sudo /dashboard/scripts/dashboard.service stop all #Stop Dashboard.
sudo /dashboard/scripts/dashboard.service status all #Check Dashboard status.
sudo /dashboard/scripts/dashboard.service restart all #Restart Dashboard.
Deploy Dashboard Enterprise Edition with RPM
Installation
-
Download an RPM package.
Enterpriseonly
You can apply online for Dashboard Enterprise Edition free trial. To purchase, contact our sales team via email (inquiry@vesoft.com). For features of Dashboard Enterprise Edition, see Pricing.
-
Run
sudo rpm -i <rpm>to install the RPM package.For example, run the following command to install Dashboard Enterprise Edition. Installation path is
/usr/local/nebula-dashboard-entby default.sudo rpm -i nebula-dashboard-ent-<version>.x86_64.rpmYou can also run the following command to specify the installation path.
sudo rpm -i nebula-dashboard-ent-xxx.rpm --prefix=<path>During the installation process, you need to enter the path to the license and choose a database for storing Dashboard metadata. Currently, we support MySQL and SQLite.
For example:
Nebula Dashboard Enterprise version need license, please enter the license file path(~/nebula.license): /home/vesoft/license/nebula.license Which database do you want to use? [sqlite | mysql]:sqlite # The default value is SQLite. Do you want to start the service now? [Y/N]: yNebula Dashboard Enterprise version need license please enter the license file path(~/nebula.license): /home/vesoft/license/nebula.license Which database do you want to use? [sqlite | mysql]:mysql Step1: set mysql database config Enter mysql host(127.0.0.1): 192.168.8.157 # The IP address of the connected MySQL database. Enter mysql service port(3306): # The port of the connected MySQL database. The default port is 3306. Enter mysql username(root): # The username to log in MySQL. Enter mysql password(nebula): # The password to log in MySQL. Enter mysql database name(dashboard): # The name of the corresponding database. Do you want to start the service now? [Y/N]: y -
(Optional) Run the following commands to view the status of and start all the services.
sudo systemctl list-dependencies nebula-dashboard.target  # View the status of all the services.
sudo systemctl start nebula-dashboard.target   # Start all the services.
You can also view, start, and stop a single service. For example:
sudo systemctl {status|stop|start} {nbd-prometheus.service|nbd-alert-manager.service|nbd-stats-exporter.service|nbd-webserver.service} -
(Optional) To configure recipients of cluster alert notifications and to configure LDAP accounts, run
vim /usr/local/nebula-dashboard-ent/config/config.yamland add the following settings.# Information of the sender's Email used to invite LDAP accounts. mail: host: smtp.office365.com # The SMTP server address. port: 587 # The port number of the SMTP server. username: "" # The SMTP server account name. password: "" # The SMTP server password. # System information system: webAddress: http://127.0.0.1:7005 # The address to access Dashboard for the invitee who is invited by mail. messageStore: 90 # It sets the number of days to keep alert messages, the value of which is 90 by default. # LDAP information ldap: server: ldap://127.0.0.1 # The LDAP server address. bindDN: cn=admin,dc=vesoft,dc=com # The LDAP login username. bindPassword: "" # The LDAP login password. baseDN: dc=vesoft,dc=com # Set the path to query user data. userFilter: "&(objectClass=*)" # Set a filter to LDAP search queries. emailKey: mail # Set the field name used to restore email in LDAP.
View logs
You can view the Dashboard Enterprise Edition operation logs in the /var/log/messages path.
For example:
sudo cat /var/log/messages
Run the following command to view the logs of each service in Dashboard:
journalctl -u {nbd-prometheus.service|nbd-alert-manager.service|nbd-stats-exporter.service|nbd-webserver.service} -b
For example, to view the logs of the Prometheus service, run the following command:
journalctl -u nbd-prometheus.service -b
Uninstallation
To uninstall Dashboard Enterprise Edition deployed with RPM, run the following command.
sudo rpm -e <package_name>
Deploy Dashboard Enterprise Edition with DEB
Installation
-
Download a DEB package.
Enterpriseonly
You can apply online for Dashboard Enterprise Edition free trial. To purchase, contact our sales team via email (inquiry@vesoft.com). For features of Dashboard Enterprise Edition, see Pricing.
-
Install the package.
sudo dpkg -i <package_name>Note
Custom installation paths are not supported when installing Dashboard Enterprise Edition with DEB. The default installation path is
/usr/local/nebula-dashboard-ent/.For example, to install the DEB package of the 3.1.0 version:
sudo dpkg -i nebula-dashboard-ent-3.1.0.ubuntu1804.amd64.debDuring the installation process, you need to enter the path to the license and choose a database for storing Dashboard metadata. Currently, we support MySQL and SQLite.
For example:
Nebula Dashboard Enterprise version need license, please enter the license file path(~/nebula.license): /home/vesoft/license/nebula.license Which database do you want to use? [sqlite | mysql]:sqlite # The default value is SQLite. Do you want to start the service now? [Y/N]: yNebula Dashboard Enterprise version need license please enter the license file path(~/nebula.license): /home/vesoft/license/nebula.license Which database do you want to use? [sqlite | mysql]:mysql Step1: set mysql database config Enter mysql host(127.0.0.1): 192.168.8.157 # The IP address of the connected MySQL database. Enter mysql service port(3306): # The port of the connected MySQL database. The default port is 3306. Enter mysql username(root): # The username to log in MySQL. Enter mysql password(nebula): # The password to log in MySQL. Enter mysql database name(dashboard): # The name of the corresponding database. Do you want to start the service now? [Y/N]: y -
(Optional) Run the following commands to view the status of and start all the services.
sudo systemctl list-dependencies nebula-dashboard.target  # View the status of all the services.
sudo systemctl start nebula-dashboard.target   # Start all the services.
You can also view, start, and stop a single service. For example:
sudo systemctl {status|stop|start} {nbd-prometheus.service|nbd-alert-manager.service|nbd-stats-exporter.service|nbd-webserver.service} -
(Optional) To configure recipients of cluster alert notifications and to configure LDAP accounts, run
vim /usr/local/nebula-dashboard-ent/config/config.yamland add the following settings.# Information of the sender's Email used to invite LDAP accounts. mail: host: smtp.office365.com # The SMTP server address. port: 587 # The port number of the SMTP server. username: "" # The SMTP server account name. password: "" # The SMTP server password. # System information system: webAddress: http://127.0.0.1:7005 # The address to access Dashboard for the invitee who is invited by mail. messageStore: 90 # It sets the number of days to keep alert messages, the value of which is 90 by default. # LDAP information ldap: server: ldap://127.0.0.1 # The LDAP server address. bindDN: cn=admin,dc=vesoft,dc=com # The LDAP login username. bindPassword: "" # The LDAP login password. baseDN: dc=vesoft,dc=com # Set the path to query user data. userFilter: "&(objectClass=*)" # Set a filter to LDAP search queries. emailKey: mail # Set the field name used to restore email in LDAP.
View logs
You can view the Dashboard Enterprise Edition operation logs in the /var/log/syslog path.
For example:
sudo cat /var/log/syslog
Run the following command to view the logs of each service in Dashboard:
journalctl -u {nbd-prometheus.service|nbd-alert-manager.service|nbd-stats-exporter.service|nbd-webserver.service} -b
For example, to view the logs of the Prometheus service, run the following command:
journalctl -u nbd-prometheus.service -b
Uninstallation
To uninstall Dashboard Enterprise Edition, run the following command.
sudo dpkg -r <package_name>
Connect to Dashboard
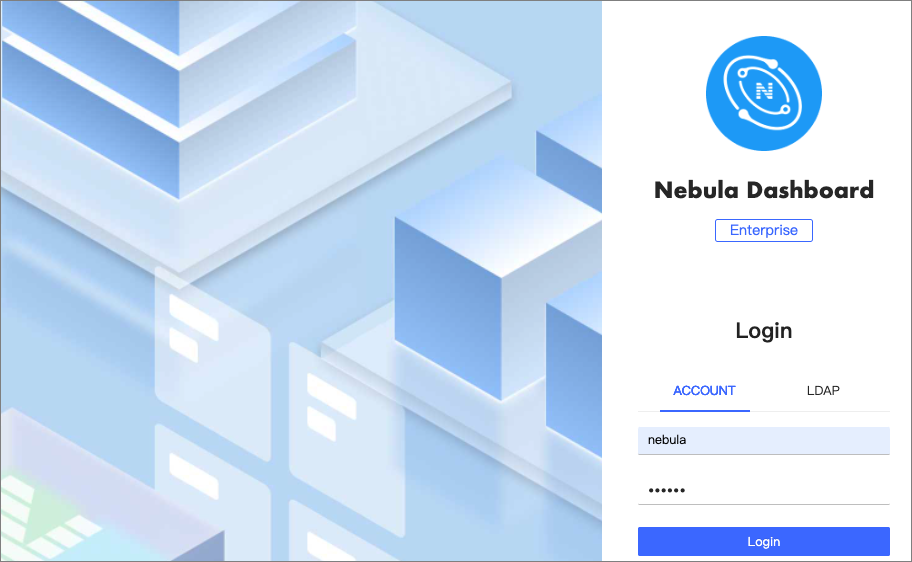
After Dashboard is successfully started, you can enter http://<ip_address>:7005 in the address bar of a browser.
If the following login interface is shown in the browser, then you have successfully deployed and started Dashboard.
Note
When logging into the Nebula Dashboard Enterprise Edition for the first time, the content of END USER LICENSE AGREEMENT is displayed on the login page. Please read it and then click I Agree.
You can log into Dashboard with the initialization account name nebula and password nebula, and then create LDAP and general accounts. You can log into Dashboard with the accounts that you have created then. For more information about the Dashboard account, see Authority Management.