Black-box monitoring tool - NebulaGraph Black Box
The black-box monitoring tool NebulaGraph Black Box (short for Nebula-BBox) helps you view black-box monitoring data. This topic introduces how to use Nebula-BBox in Linux.
Enterpriseonly
Nebula-BBox is only available for the NebulaGraph Enterprise Edition.
Nebula-BBox features
Nebula-BBox provides the following features:
- View monitoring metric data via TUI, Terminal User Interface.
- Export data as CSV files.
- View data in different dimensions.
- View data for one or more metrics.
- View data for a certain time.
- View data from one or more directories or files, or mixed.
- Support Linux, macOS, and Windows systems.
Version compatibility
The version correspondence between NebulaGraph and Nebula-BBox is as follows.
| NebulaGraph | Nebula-BBox |
|---|---|
| 3.4.0 | 3.4.0 |
Deploy Nebula-BBox
You can deploy Nebula-BBox with RPM, DEB, or TAR packages, or with Docker. The following example uses RPM packages.
-
Obtain an RPM package.
Enterpriseonly
Contact us to get the Nebula-BBox installation package.
-
Run
sudo rpm -i <rpm>to install the package. For example:sudo rpm -i nebula-bbox-<version>.x86_64.rpmNebula-BBox is installed in the default path
/usr/bin/in the form of a binary filenebula-bbox.
Use Nebula-BBox
Run nebula-bbox -h/--help to view the available commands.
Caution
For Nebula-BBox installed in a non-default path (default path is /usr/bin/), when executing nebula-bbox related commands, it is necessary to specify the installation path of Nebula-BBox. For example, if Nebula-BBox is installed in /usr/bbox, then you need to execute /usr/bbox/nebula-bbox -h.
View Nebula-BBox version
Run nebula-bbox version to view the version information of Nebula-BBox.
View black-box monitoring metrics
Run nebula-bbox metrics to view all the metrics collected by Nebula-BBox. For details about the description of metrics, see PROC(5).
View black-box monitoring data
You can use Nebula-BBox to view black-box monitoring file data. The syntax is as follows:
nebula-bbox view [(-o|--output=)tui|csv] [--metrics name[,name ...]] [flags] (FILE | DIRECTORY ...)
Parameters
| Parameter | Description |
|---|---|
-o,--output |
Specifies the output display format. Optional values are tui and csv. The default value is tui when this parameter is not specified.tui: The output display format is TUI, Terminal User Interface.csv: The output display format is a CSV file. |
--metrics |
Specifies one or multiple metrics. Optional values can be the metrics returned by running nebula-bbox metrics, and all metrics are displayed when this parameter is not specified.When specifying multiple metrics, separate them with commas, for example --metrics <name>,<name>.... |
flags |
You can specify other parameters: --output-file: When the value of -o or --output is csv, you need to specify it to define the storage path and file name of the CSV file.--start-time: View metric data from the defined start time to the current time.--end-time: Defines the end time to view data collected during a period, used with --start-time.--duration: Defines a duration to view data collected during the duration, used with --start-time, not used with --end-time. |
Examples
The following examples assume that the NebulaGraph cluster is installed in the default path /usr/local/nebula/ and the black-box monitoring data is stored in the default path /usr/local/nebula/data/bbox/.
Note
Before you want to specify one or multiple metrics, run nebula-bbox metrics to view all the metrics that you can specify. For details, see the context above.
| Cases | Commands |
|---|---|
| View the data of all metrics by specifying a single file. | nebula-bbox view /usr/local/nebula/black_box/<pid>/black_box.<timestamp>.log |
| View the data of all metrics by specifying multiple files. | nebula-bbox view /usr/local/nebula/black_box/<pid>/black_box.<timestamp1>.log /usr/local/nebula/black_box/<pid>/black_box.<timestamp2>.log |
| View the data of all metrics by specifying all files. | nebula-bbox view /usr/local/nebula/black_box |
| View the data of all metrics by specifying multiple subdirectories. | nebula-bbox view /usr/local/nebula/black_box/<pid1> /usr/local/nebula/black_box/<pid2> |
| View the data of all metrics by specifying a subdirectory and a single file. | nebula-bbox view /usr/local/nebula/black_box/<pid1> /usr/local/nebula/black_box/<pid2> /usr/local/nebula/black_box/<pid3>/black_box.<timestamp>.log |
| View the data of a specified metric in a single file. | nebula-bbox view --metrics <name> /usr/local/nebula/black_box/<pid>/black_box.<timestamp>.log |
| View the data of a specified metric of all files. | nebula-bbox view --metrics <name> /usr/local/nebula/black_box |
| View the data of specified metrics of all files in the form of a CSV file. | nebula-bbox view --metrics <name1>[,<name2> ...] --output csv --output-file <csv_filename>.csv /usr/local/nebula/black_box |
| View the data of multiple specified metrics of all files. | nebula-bbox view --metrics <name1>[,<name2> ...] /usr/local/nebula/black_box |
| View the data of all metrics of all files from noon September 6, 2022, Beijing time until now. | nebula-bbox view --start-time "Tue, 06 Sep 2022 12:00:00 +0800" /usr/local/nebula/black_boxThe replacement of Tue, 06 Sep 2022 12:00:00 +0800 can be 2022-09-06T12:00:00+08:00 and 2022-09-06 04:00:00 +0800. |
| View the data of all metrics of all files within one hour starting from noon September 6, 2022, Beijing time. | nebula-bbox view --start-time "Tue, 06 Sep 2022 12:00:00 +0800" --duration 1h /usr/local/nebula/black_box. You can use h、m、s to specify a duration. |
| View the data of all metrics of all files from noon September 6, 2022, Beijing time to 13:00 September 6, 2022, Beijing time. | nebula-bbox view --start-time "2022-09-06 04:00:00 +0800" --end-time "2022-09-06 05:00:00 +0800" /usr/local/nebula/black_box |
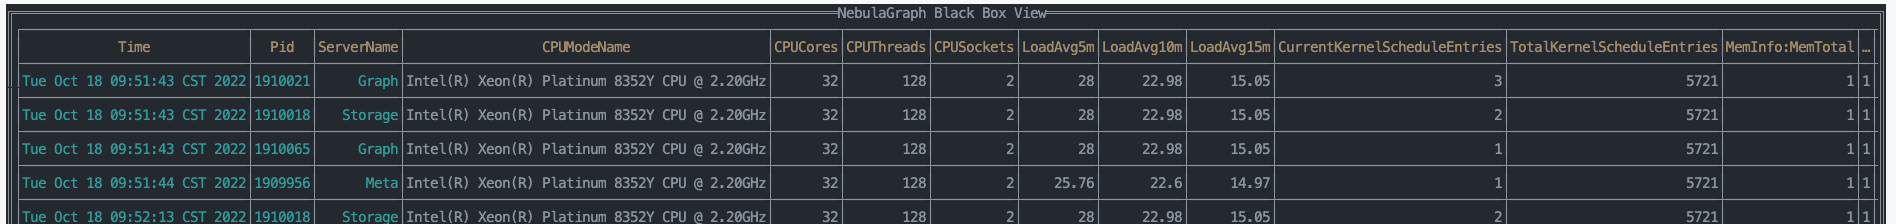
TUI mode and shortcuts
The TUI mode displays monitoring data in the form of a table. The first line of the table shows the time, service PID based on which metrics are collected, service name, and metric names.
You can use the following shortcuts to view data in TUI mode.
| Shortcut | Description |
|---|---|
F1 |
Displays help. |
Left |
Move left. |
Right |
Move right. |
Down |
Move down. |
Up |
Move up. |
Ctrl-A or Home |
Jump to the first column of the current line. |
Ctrl-E or End |
Jump to the last column of the current line. |
Ctrl-T |
Jump to the first line. |
Ctrl-B |
Jump to the last line. |
Enter |
View the detailed information in a table cell. |
Escape |
Quit displaying cell details. |
FAQ
Q: Why does my TUI interface display as follows?
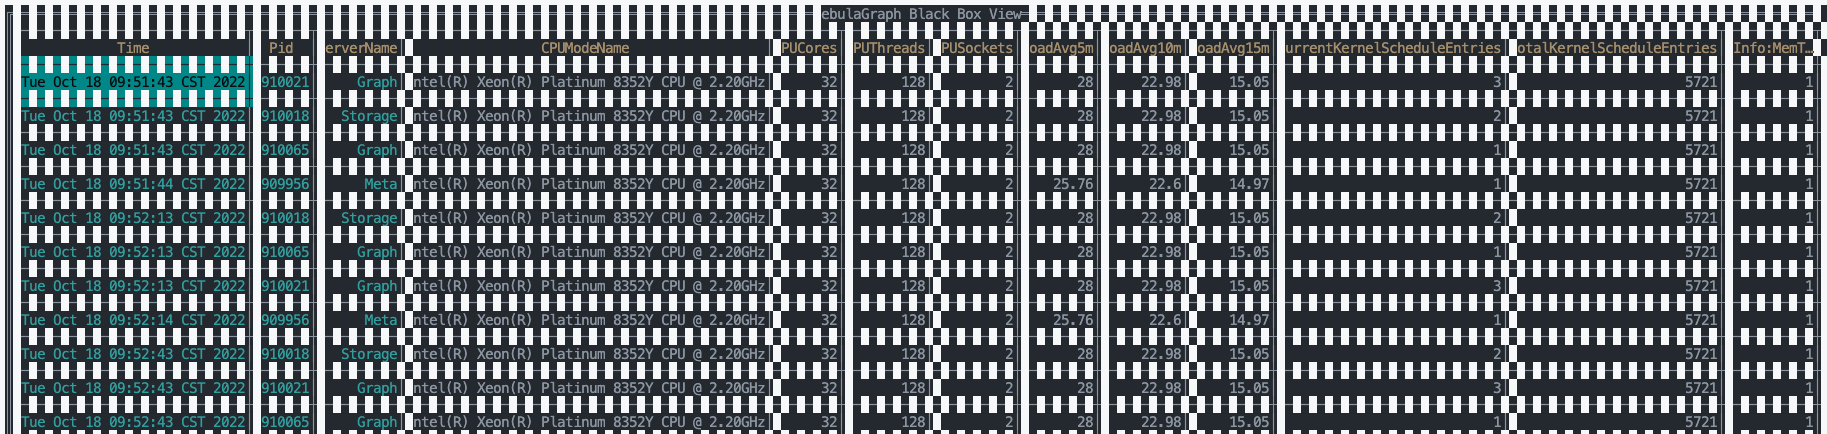
A: The situation shown above is due to a mismatch in the Linux system character set. Run export LC_CTYPE="en_US.UTF-8" to solve the problem.