Cluster monitoring
This topic introduces node monitoring, service monitoring, graph space monitoring, and TV Dashboard.
At the top navigation bar of the Dashboard Enterprise Edition page, click Cluster Management, and click Detail at the right of the target cluster. Monitoring at the left navigation bar contains Node, Service and TV Dashboard.
Node
Click Monitoring->Node to enter the node monitoring page.
On this page, you can view the variation of CPU, Memory, Load, Disk, and Network In/Out quickly.
- By default, you can view the monitoring data of the maximum of 14 days. You can also select a time range or quickly select latest 1 hour, 6 hours, 12 hours, 1 day, 3 days, 7days, or 14 days.
- By default, you can view the monitoring data of all the instances in clusters. You can select the instances you want to view in the instance box.
- By default, the monitoring information page will not be updated automatically. You can set the update frequency of the monitoring information page globally or click the
 button to update the page manually.
 - To set a base line, click the
 button.
 -
To view the detailed monitoring information, click the
 button. In this example, select
 Loadfor details. The figure is as follows.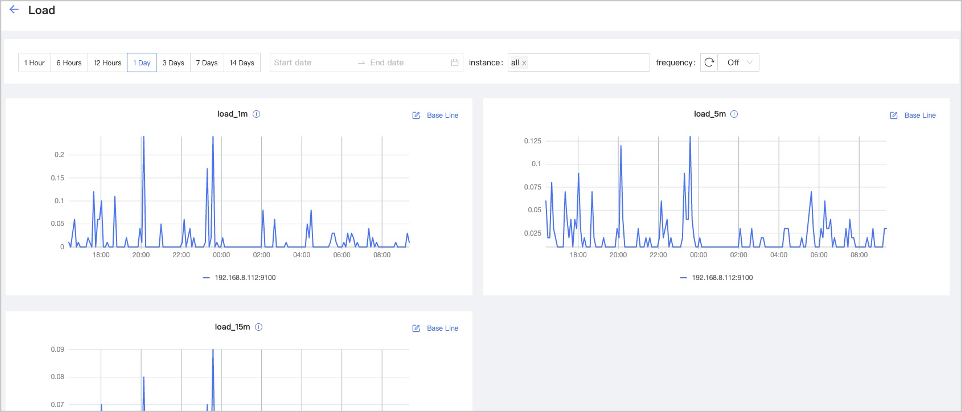
- You can set the monitoring time range, instance, update frequency and base line.
- You can select the machine and monitoring metrics that you want to view. For details of monitoring metrics, see Monitor parameter.
Service
Click Monitoring->Service to enter the service monitoring page.
On this page, you can view the information of Graph, Meta, and Storage services quickly. In the upper right corner, the number of normal services and abnormal services will be displayed.
Note
In the current Service page of the Enterprise Edition, only two monitoring metrics can be set for each service, which can be adjusted by clicking the Set up button.
- By default, you can view the monitoring data of the maximum of 14 days. You can also select a time range or quickly select latest 1 hour, 6 hours, 12 hours, 1 day, 3 days, 7days, or 14 days.
- By default, you can view the monitoring data of all the instances in clusters. You can select the instances you want to view in the instance box.
- By default, the monitoring information page will not be updated automatically. You can set the update frequency of the monitoring information page globally or click the button to update the page manually.
- You can view the status of all the services in cluster.
-
To view the detailed monitoring information, click the
button. In this example, select Graphfor details. The figure is as follows.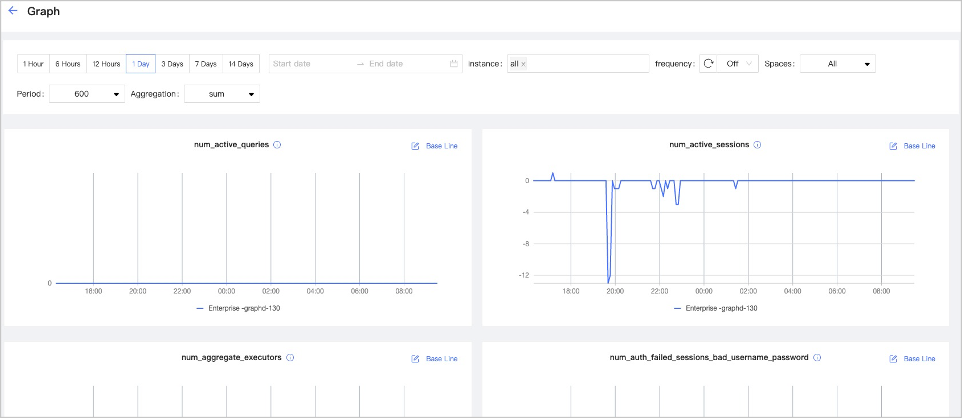
- You can set the monitoring time range, instance, update frequency, period, aggregation and base line.
- You can view all the monitoring information of the service. For details of monitoring metrics, see Monitor parameter.
- The Graph service supports a set of space-level metrics. For more information, see the following section Graph space.
Graph space
Note
Before using graph space metrics, you need to set enable_space_level_metrics to true in the Graph service. For details, see Update config.
Space-level metric incompatibility
If a graph space name contains special characters, the corresponding metric data of that graph space may not be displayed.
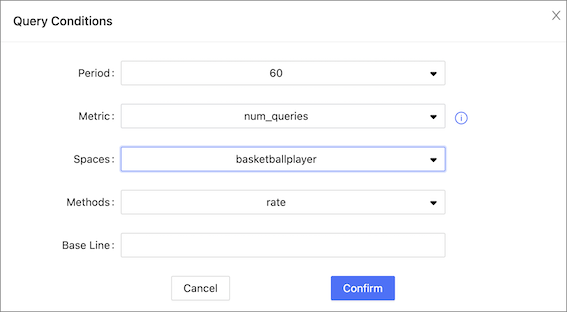
The service monitoring page can also monitor graph space level metrics. Only when the behavior of a graph space metric is triggered, you can specify the graph space to view information about the corresponding graph space metric.
Space graph metrics record the information of different graph spaces separately. Currently, only the Graph service supports a set of space-level metrics.
For information about the space graph metrics, see Space graph.
TV Dashboard
The TV Dashboard feature helps users understand the health status of the cluster and the information of services and nodes at a glance.
Click Monitoring->TV Dashboard to enter the TV Dashboard page.
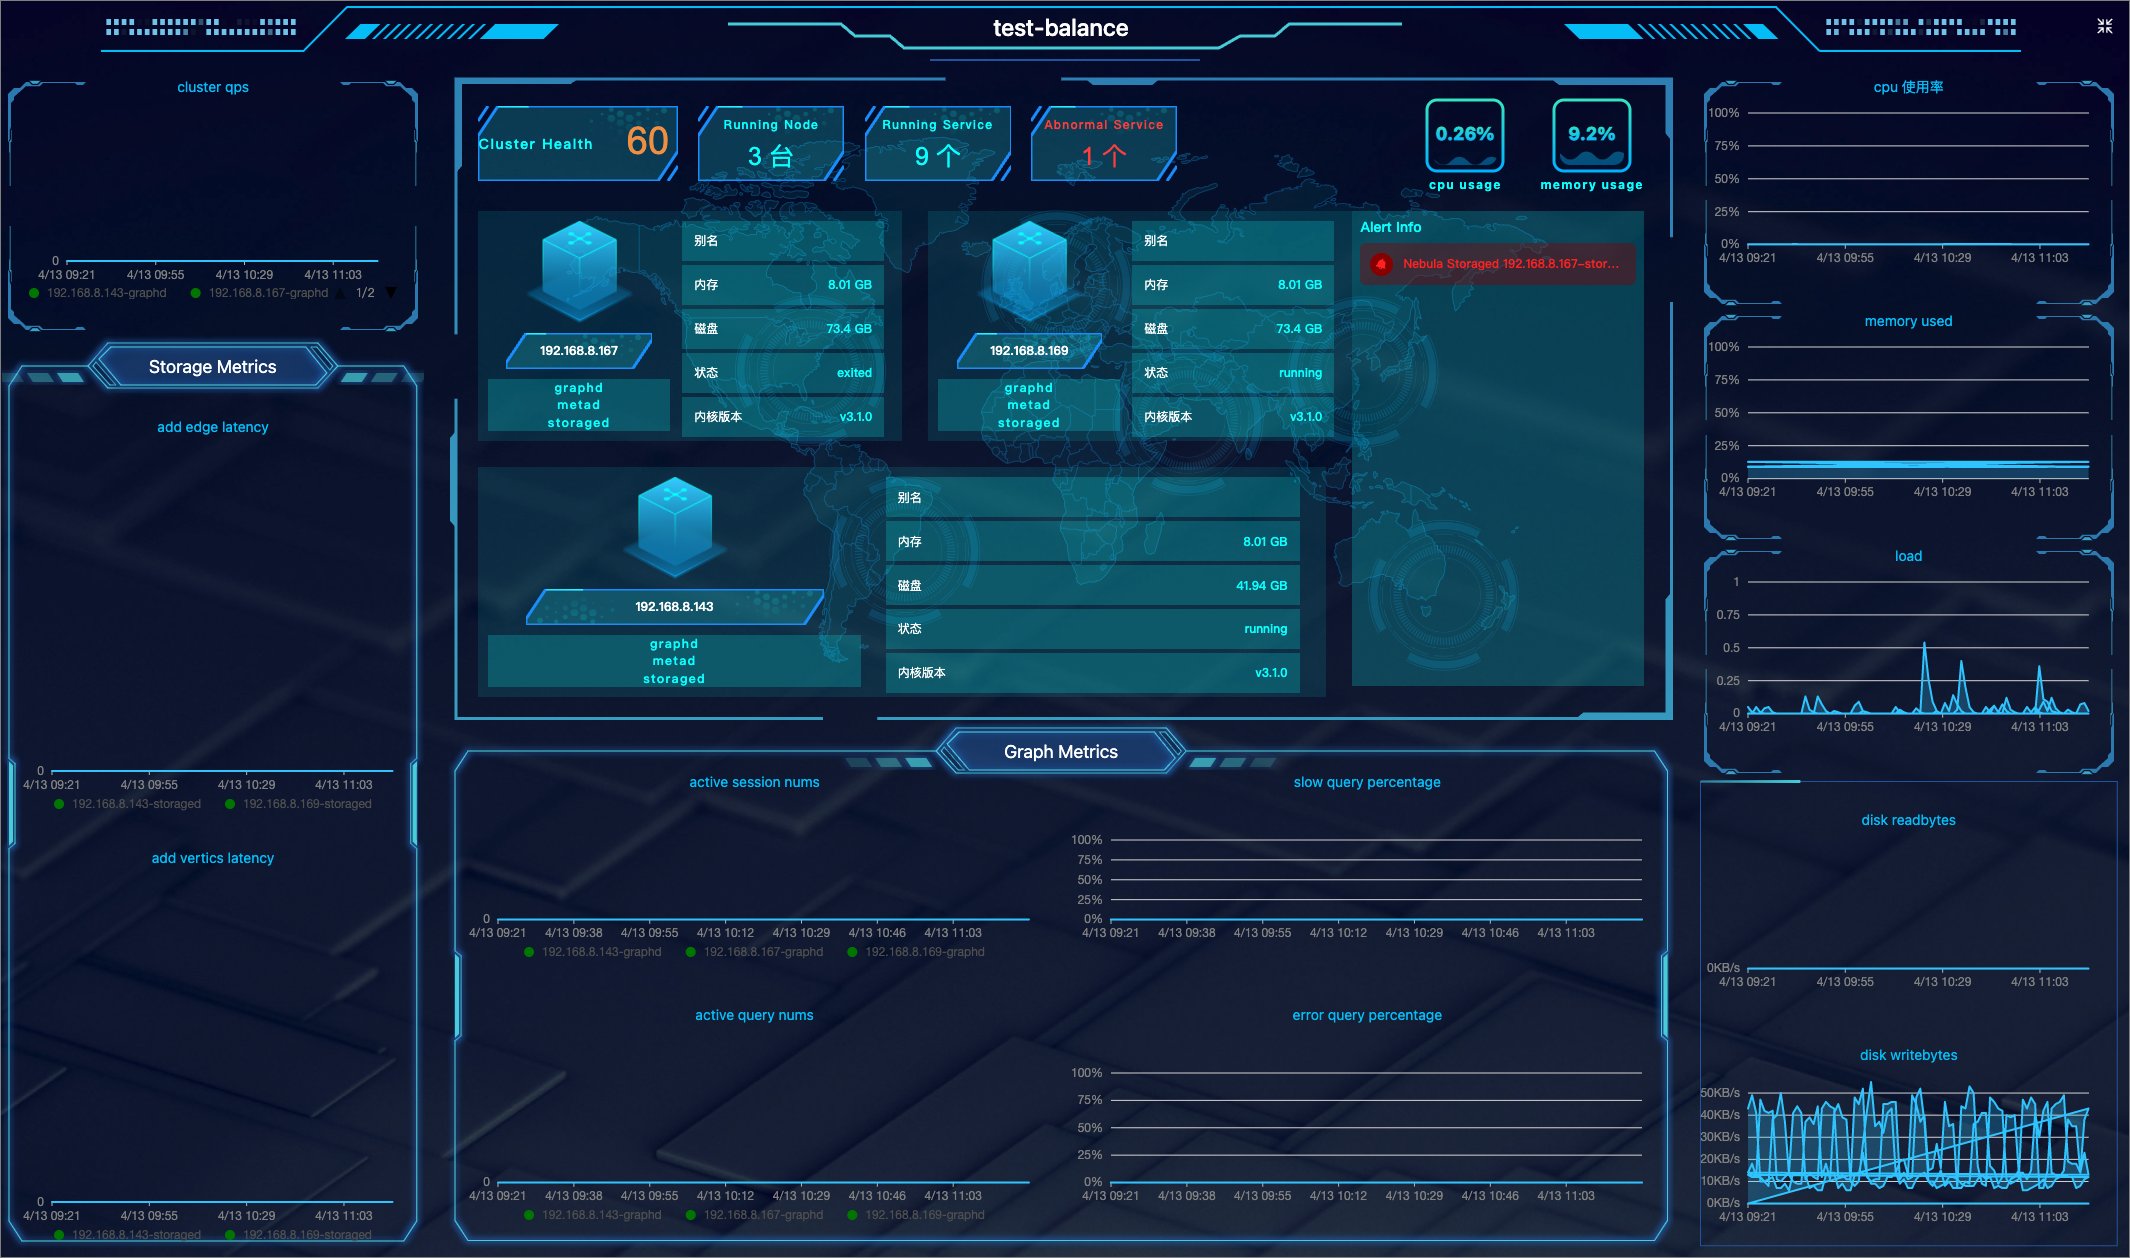
| Screen area | Information displayed |
|---|---|
| Upper middle area | 1. The health degree of your cluster. The system scores the health of your cluster. For more information, see the following note. 2. The information and number of running nodes, the number of running services and abnormal services in the cluster. 3. CPU and memory usage of the node at the current time. 4. Alert notifications. The system displays the 5 most recently triggered alert messages based on their severity level (emergency>critical>warning). For more information, Monitoring alerts. |
| Lower middle area | Monitoring information of 4 Graph service metrics at different periods. The 4 metrics are: 1. num_active_sessions 2. num_slow_queries 3. num_active_queries 4. num_query_errors |
| Left side of the area | 1. QPS (Query Per Second) of your cluster. 2. The monitoring information of 2 Storage service metrics at different periods. The two metrics are: add_edges_latency_us,add_vertices_latency_us. |
| Right side of the area | The node-related metrics information at different periods. Metrics include: 1. cpu_utilization 2. memory_utilization 3. load_1m 4. disk_readbytes 5. disk_writebytes |
For more information about the monitoring metrics, see Metrics.
Note
Cluster scoring rules are as follows:
- The maximum score is 100; The minimum score is 13.
- When 100≥Health Degree≥80, the score is blue; When 80>Health Degree≥60, the score is yellow; When Health Degree<60, the score is yellow.
- Algorithm: (1-number of abnormal services/total number of services)*100%.
- Except for the appearance of the first
emergencylevel alert that deducts 40 points, 10 points are deducted for each of the otheremergencylevel alerts and other levels of alerts.