Alerts
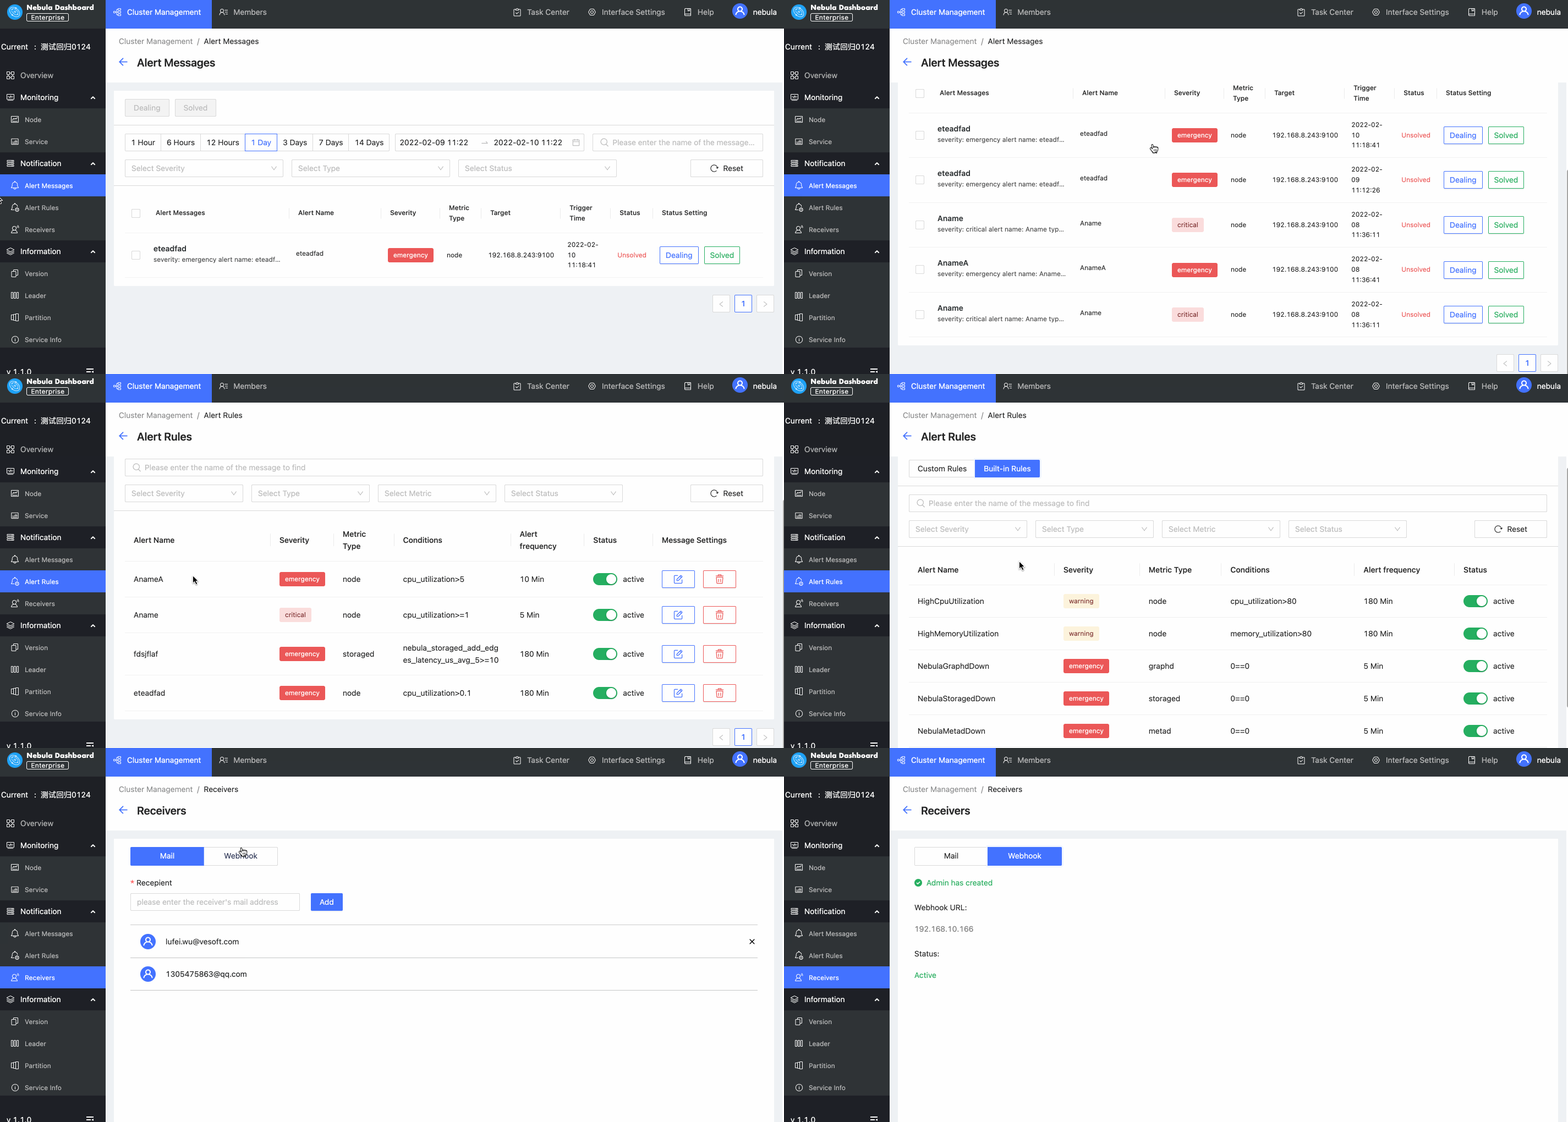
NebulaGraph Dashboard Enterprise Edition alerts on monitoring metrics. You can view alert messages, set alert rules, and set alert receivers.
At the top navigation bar of the Dashboard Enterprise Edition page, click Cluster Management, and click Detail at the right of the target cluster. Notification at the left navigation bar contains Alert Messages, Alert Rules and Receivers.

Alert messages
Alert messages will pop up in the upper right corner of the page, you can do the following operations:
- Click the View button to go to the Notification->Alert Messages page to view detailed alert information.
- Click the Mute buttons, the alert rule will not be triggered again for 2 hours.
You can perform the following operations on the Alert Messages page:
- You can search for alert messages by message name.
- You can filter alert messages by date and time, and period. Available periods are 1 hour, 6 hours, 12 hours, 1 day, 3 days, 7 days, and 14 days.
- You can filter alert messages by severity, type, and status. Click Reset to empty all filtering results.
- You can set the processing status of alert messages. The status is
unsolvedby default, and you can set the status toDealingorSolved.
Alert messages cannot be deleted. In the nebula-dashboard-ent/config/config.yaml file, messageStore sets the number of days to keep alert messages, the value of which is 90 by default. For more information about the configuration file, see Deploy Dashboard.
Alert rules
Before receiving alert messages, you need to set alert rules. Alert rules include custom rules and build-in rules.
Create custom rules
Follow the below steps to create a custom rule.
- At the top navigation bar of the Dashboard Enterprise Edition page, click Cluster Management, and then on the right side of the target cluster, click Detail.
- On the left side of the Cluster Management page, click Notification->Alert Rules.
- On the Alert Rules page, click Custom Rules, and then click Create Rule at the top right of the page.
-
Set alert rules.
-
On the Basic Information tab, set alert name, severity, and frequency.
Parameter Description Alert Name Set a name for an alert rule. The name can only contain lowercase letters, numbers, and hyphens ( -), and must begin and end with a lowercase letter or number. The name contains up to 253 characters.Severity Set a severity level for an alert rule. The severity level includes emergency,critical, andwarning.Alert Frequency Set how often an alert message is sent. Unit: Minute (Min). -
On the Condition tab, set metric type, rule, and alert duration.
Parameter Description Metric Type Set a metric type. Metric type includes the node metric type and the service type (graphd,storaged,metad). Metric Rule Set metric rules for a node or a service. For more information, see Monitoring metrics. Alert duration Set how long an alert lasts before the alert message is triggered. Unit: Minute (Min). -
On the Message Settings tab, you can see the rule summary and rule details, and then click Submit.
Note
DO NOT modify the rule details unless you are clear of the consequences.
-
View custom rules
On the Custom Rules, you can do the following operations.
- Search for alert rules and filter alert rules by severity, type, metric, and status.
- Click Reset to empty all filtering results.
- Turn on or off the alert rule you set. The status of an alert rule that has been turned on is active. The status of an alert rule that has been turned off is disable.
Edit custom rules
In the Custom Rules list, select the target rule, and then click the edit icon  to edit the rule.
Delete custom rules
In the Custom Rules list, select the target rule, click the delete icon  to delete the rule.
Built-in Rules
The built-in rules are the default rules in Dashboard Enterprise Edition. You can enable or disable the built-in rules. The status of a built-in rule that has been turned on is active. The status of a built-in rule that has been turned off is disable.
Note
Built-in rules cannot be edited or deleted.
Receiver configuration
Alerts can be configured to send notifications to receivers. You can set the email address of the receiver who receives alert notifications. You can also view your Webhook URL and whether the webhook is enabled or not. For more information about the Webhook, see Global settings.
- At the top navigation bar of the Dashboard Enterprise Edition page, Click Cluster Management, and on the right side of the target cluster, click Detail.
- On the left-side navigation bar of the Cluster Management page, click Notification->Receivers.
-
On the Receivers page,
- Click Mail and input the email of the receiver who receives alert notifications and then click Add.
- Click Webhook and see your Webhook URL and whether the webhook is enabled or not.