An introduction to graphs
People from tech giants (such as Amazon and Facebook) to small research teams are devoting significant resources to exploring the potential of graph databases to solve data relationships problems. What exactly is a graph database? What can it do? Where does it fit in the database landscape? To answer these questions, we first need to understand graphs.
Graphs are one of the main areas of research in computer science. Graphs can efficiently solve many of the problems that exist today. This topic will start with graphs and explain the advantages of graph databases and their great potential in modern application development, and then describe the differences between distributed graph databases and several other types of databases.
What are graphs?
Graphs are everywhere. When hearing the word graph, many people think of bar charts or line charts, because sometimes we call them graphs, which show the connections between two or more data systems. The simplest example is the following picture, which shows the number of NebulaGraph GitHub repository stars over time.

This type of diagram is often called a line chart. As you can see, the number of starts rises over time. A line chart can show data changes over time (depending on the scale settings). Here we have given only examples of line charts. There are various graphs, such as pie charts, bar charts, etc.
Another kind of diagram is often used in daily conversation, such as image recognition, retouched photos. This type of diagram is called a picture/photo/image.

The diagram we discuss in this topic is a different concept, the graph in graph theory.
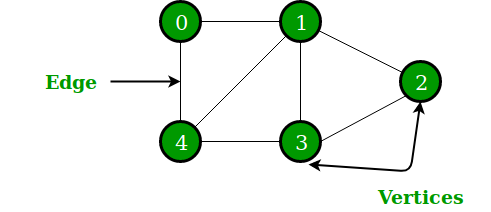
In graph theory, a branch of mathematics, graphs are used to represent the relationships between entities. A graph consists of several small dots (called vertices or nodes) and lines or curves (called edges) that connect these dots. The term graph was proposed by Sylvester in 1878.
The following picture is what this topic calls a graph.
Simply put, graph theory is the study of graphs. Graph theory began in the early 18th century with the problem of the Seven Bridges of Königsberg. Königsberg was then a Prussian city (now part of Russia, renamed Kaliningrad). The river Preger crossed Königsberg and not only divided Königsberg into two parts, but also formed two small islands in the middle of the river. This divided the city into four areas, each connected by seven bridges. There was a game associated with Königsberg at the time, namely how to cross each bridge only once and navigate the entire four areas of the city. A simplified view of the seven bridges is shown below. Try to find the answer to this game if you are interested 1.

To solve this problem, the great mathematician Euler proved that the problem was unsolvable by abstracting the four regions of the city into points and the seven bridges connecting the city into edges connecting the points. The simplified abstract diagram is as follows 2.

The four dots in the picture represent the four regions of Königsberg, and the lines between the dots represent the seven bridges connecting the four regions. It is easy to see that the area connected by the even-numbered bridges can be easily passed because different routes can be chosen to come and go. The areas connected by the odd-numbered bridges can only be used as starting or endings points because the same route can only be taken once. The number of edges associated with a node is called the node degree. Now it can be shown that the Königsberg problem can only be solved if two nodes have odd degrees and the other nodes have even degrees, i.e., two regions must have an even number of bridges and the remaining regions have an odd number of bridges. However, as we know from the above picture, there is no even number of bridges in any region of Königsberg, so this puzzle is unsolvable.
Property graphs
From a mathematical point of view, graph theory studies the relationships between modeled objects. However, it is common to extend the underlying graph model. The extended graphs are called the attribute graph model. A property graph usually consists of the following components.
- Node, an object or entity. In this topic, nodes are called vertices.
- Relationship between nodes. In this topic, relationships are called edges. Usually, the edges can be directed or undirected to indicate a relationship between two entities.
- There can be properties on nodes and edges.
In real life, there are many examples of property graphs.
For example, Qichacha or BOSS Zhipin use graphs to model business equity relationships. A vertex usually represents a natural person or a business, and the edge represents the equity relationship between a person and a business. The properties on vertices can be the name, age, ID number, etc. of the natural person. The properties on edges can be the investment amount, investment time, position such as director and supervisor.
A vertex can be a listed company and an edge can be a correlation between listed companies. The vertex property can be a stock code, abbreviation, market capitalization, sector, etc. The edge property can be the time-series correlation coefficient of the stock price 3.
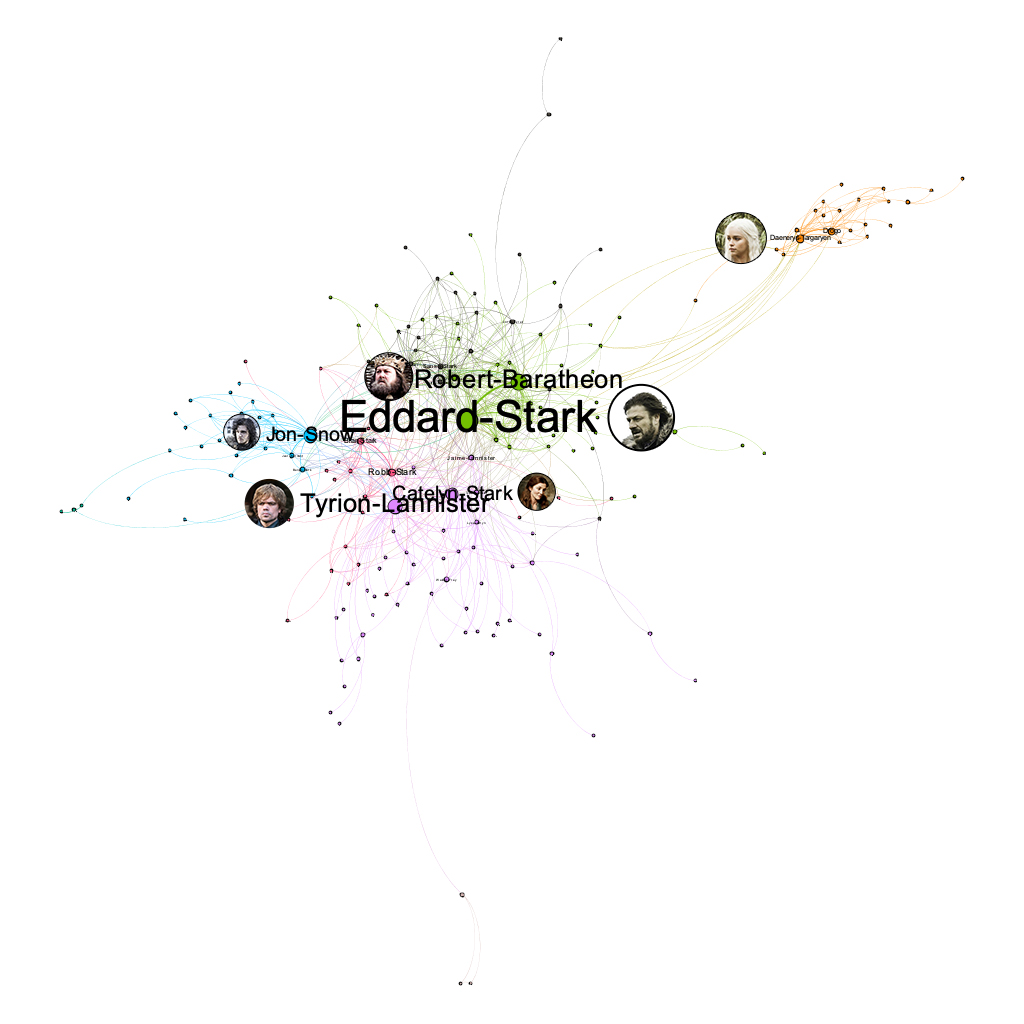
The graph relationship can also be similar to the character relationship in a TV series like Game of Thrones 4. Vertices stand for the characters. Edges represent the interactions between the characters. Vertex properties are the character's names, ages, camps, etc., and edge properties are the number of interactions between two characters.
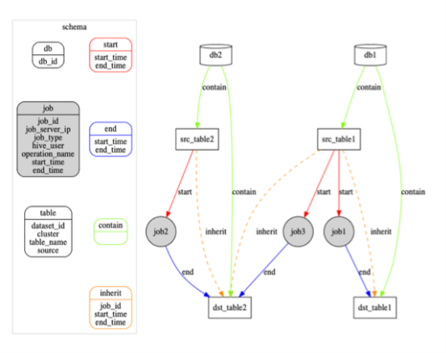
Graphs are also used for governance within IT systems. For example, a company like WeBank has a very large data warehouse and corresponding data warehouse management tools. These management tools record the ETL relationships between the Hive tables in the data warehouse through Job implementation 5. Such ETL relationships can be very easily presented and managed in the form of graphs, and the root cause can be easily traced when problems arise.
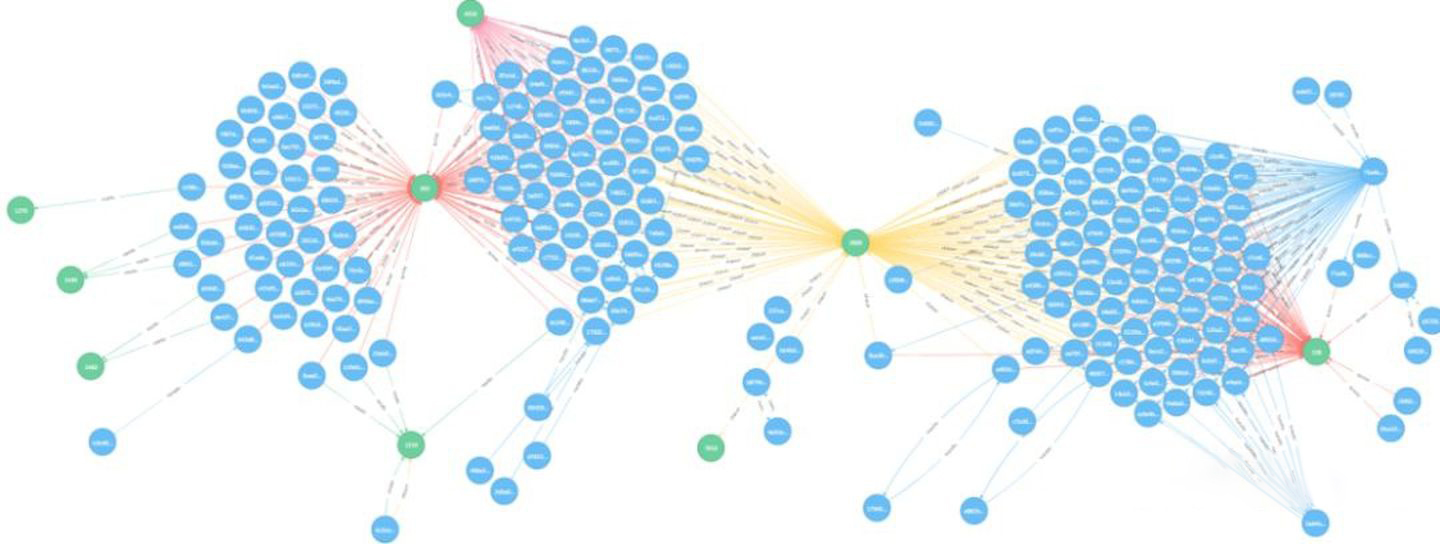
Graphs can also be used to document the invocation relationships between the intricate microservices within a large IT system 6, which is used by operations teams for service governance. Here each point represents a microservice and the edge represents the invocation relationship between two microservices; thus, Ops can easily find invocation links with availability below a threshold (99.99%) or discover microservice nodes that would be particularly affected by a failure.
Graphs are also used to record the invocation relationships between the intricate microservices 6. Each vertex represents a microservice and an edge represents the invocation relationship between two microservices. This allows Ops to easily find call links with availability below a threshold (99.99%), or to discover microservice nodes where a failure would have a particularly large impact.
Graphs can also be used to improve the efficiency of code development. Graphs store function call relationships between codes 6 to improve the efficiency of reviewing and testing the code. In such a graph, each vertex is a function or variable, each edge is a call relationship between functions or variables. When there is a new code commit, one can more easily see other interfaces that may be affected, which helps testers better assess potential go-live risks.
In addition, we can discover more scenarios by adding some temporal information as opposed to a static property graph that does not change.
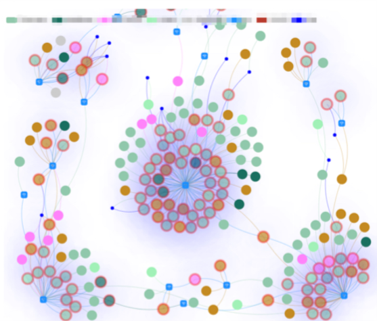
For example, inside a network of interbank account fund flows 7, a vertex is an account, an edge is the transfer record between accounts. Edge properties record the time, amount, etc. of the transfer. Companies can use graph technology to easily explore the graph to discover obvious misappropriation of funds, paying back a load to with the loan, loan gang scams, and other phenomena.
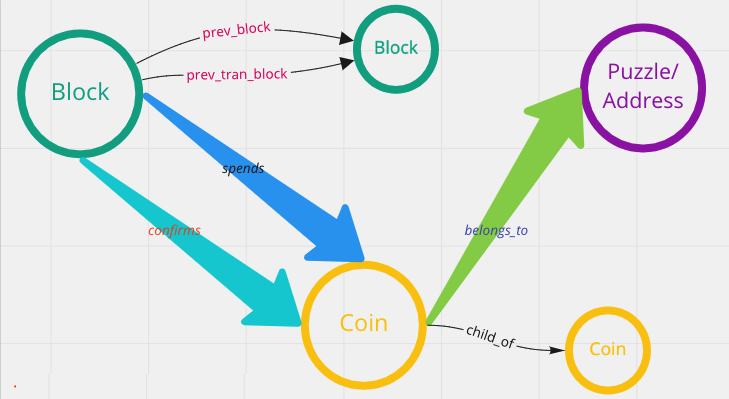
The same approach can be used to explore the discovery of the flow of cryptocurrencies.
In a network of accounts and devices 8, vertices can be accounts, mobile devices, and WIFI networks, edges are the login relationships between these accounts and mobile devices, and the access relationships between mobile devices and WIFI networks.
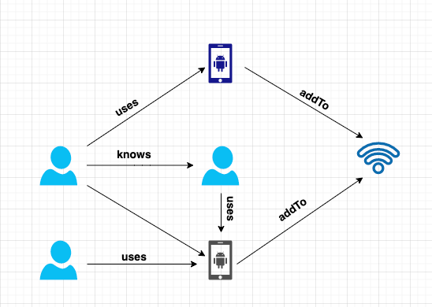
These graph data records the characteristic of the network black production operations. Some big companies such as 360 DigiTech8, Kuaishou9, WeChat10, Zhihu11, and Ctrip Finance all identified over a million crime groups through technology.
In addition to the dimension of time, you can find more scenarios for property graphs by adding some geographic location information.
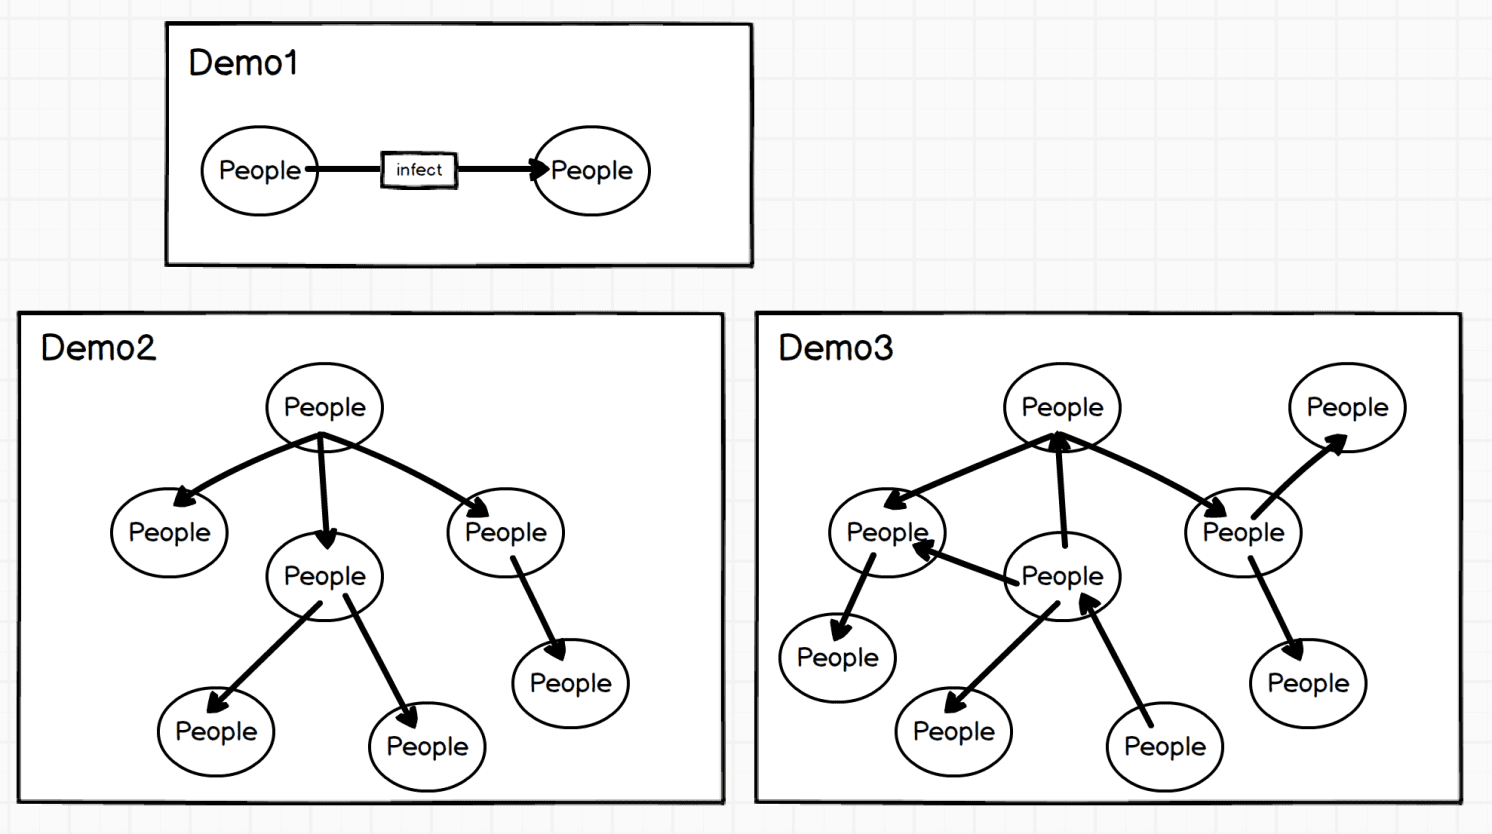
For an example of tracing the source of the Coronavirus Disease (COVID-19) 12, vertices are the person and edges are the contact between people. Vertex properties are the information of the person's ID card and onset time, and edge properties are the time and geographical location of the close contact between people, etc. It provides help for health prevention departments to quickly identify high-risk people and their behavioral trajectories.
The combination of geographic location and graph is also used in some O2O scenarios, such as real-time food recommendation based on POI (Point-of-Interest) 13, which enables local life service platform companies like Meituan to recommend more suitable businesses in real-time when consumers open the APP.
A graph is also used for knowledge inference. Huawei, Vivo, OPPO, WeChat, Meituan, and other companies use graphs for the representation of the underlying knowledge relationships.
Why do we use graph databases?
Although relational databases and semi-structured databases such as XML/JSON can be used to describe a graph-structured data model, a graph (database) not only describes the graph structure and stores data itself but also focuses on handling the associative relationships between the data. Specifically, graph databases have several advantages:
- Graphs are a more visual and intuitive way of representing knowledge to human brains. This allows us to focus on the business problem itself rather than how to describe the problem as a particular structure of the database (e.g., a table structure).
-
It is easier to show the characteristic of the data in graphs. Such as transfer paths and nearby communities. To analyze the relationships of characters and character importance in Game of Thrones, data displayed with tables is not as intuitive as with graphs.

Especially when some central vertices are deleted:

Adding an edge can completely change the entire topology.

We can intuitively sense the importance of minor changes in graphs rather than in tables.
-
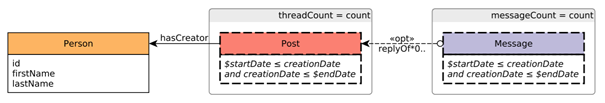
Graph query language is designed based on graph structures. The following is a query example in LDBC. Requirements: Query the posts posted by a person, and query the corresponding replies (the replies themselves will also be replied multiple times). Since the posting time and reply time both meet certain conditions, you can sort the results according to the number of replies.
Write querying statements using PostgreSQL:
--PostgreSQL
WITH RECURSIVE post_all(psa_threadid
                      , psa_thread_creatorid, psa_messageid
                      , psa_creationdate, psa_messagetype
                       ) AS (
    SELECT m_messageid AS psa_threadid
         , m_creatorid AS psa_thread_creatorid
         , m_messageid AS psa_messageid
         , m_creationdate, 'Post'
      FROM message
     WHERE 1=1 AND m_c_replyof IS NULL -- post, not comment
       AND m_creationdate BETWEEN :startDate AND :endDate
  UNION ALL
    SELECT psa.psa_threadid AS psa_threadid
         , psa.psa_thread_creatorid AS psa_thread_creatorid
         , m_messageid, m_creationdate, 'Comment'
      FROM message p, post_all psa
     WHERE 1=1 AND p.m_c_replyof = psa.psa_messageid
     AND m_creationdate BETWEEN :startDate AND :endDate
)
SELECT p.p_personid AS "person.id"
     , p.p_firstname AS "person.firstName"
     , p.p_lastname AS "person.lastName"
     , count(DISTINCT psa.psa_threadid) AS threadCount
END) AS messageCount
     , count(DISTINCT psa.psa_messageid) AS messageCount
  FROM person p left join post_all psa on (
       1=1   AND p.p_personid = psa.psa_thread_creatorid
   AND psa_creationdate BETWEEN :startDate AND :endDate
   )
 GROUP BY p.p_personid, p.p_firstname, p.p_lastname
 ORDER BY messageCount DESC, p.p_personid
 LIMIT 100;
Write querying statements using Cypher designed especially for graphs:
--Cypher
MATCH (person:Person)<-[:HAS_CREATOR]-(post:Post)<-[:REPLY_OF*0..]-(reply:Message)
WHERE post.creationDate >= $startDate AND post.creationDate <= $endDate
  AND reply.creationDate >= $startDate AND reply.creationDate <= $endDate
RETURN
  person.id, person.firstName, person.lastName, count(DISTINCT post) AS threadCount,
  count(DISTINCT reply) AS messageCount
ORDER BY
  messageCount DESC, person.id ASC
LIMIT 100
- Graph traversal (corresponding to Join in SQL) is much more efficient because the storage and query engines are designed specifically for the structure of the graph.
- Graph databases have a wide range of application scenarios. Examples include data integration (knowledge graph), personalized recommendations, fraud, and threat detection, risk analysis, and compliance, identity (and control) verification, IT infrastructure management, supply chain, and logistics, social network research, etc.
- According to the literature 14, the fields that use graph technology are (from the greatest to least): information technology (IT), research in academia, finance, laboratories in industry, government, healthcare, defense, pharmaceuticals, retail, and e-commerce, transportation, telecommunications, and insurance.
- In 2019, according to Gartner's questionnaire research, 27% of customers (500 groups) are using graph databases and 20% have plans to use them.
RDF
This topic does not discuss the RDF data model due to space limitations.
-
Souce of the picture: https://medium.freecodecamp.org/i-dont-understand-graph-theory-1c96572a1401. ↩
-
Source of the picture: https://medium.freecodecamp.org/i-dont-understand-graph-theory-1c96572a1401 ↩
-
https://nebula-graph.com.cn/posts/stock-interrelation-analysis-jgrapht-nebula-graph/ ↩
-
https://nebula-graph.com.cn/posts/game-of-thrones-relationship-networkx-gephi-nebula-graph/ ↩
-
https://nebula-graph.com.cn/posts/practicing-nebula-graph-webank/ ↩
-
https://nebula-graph.com.cn/posts/meituan-graph-database-platform-practice/ ↩↩↩
-
https://zhuanlan.zhihu.com/p/90635957 ↩
-
https://nebula-graph.com.cn/posts/graph-database-data-connections-insight/ ↩↩
-
https://nebula-graph.com.cn/posts/kuaishou-security-intelligence-platform-with-nebula-graph/ ↩
-
https://nebula-graph.com.cn/posts/nebula-graph-for-social-networking/ ↩
-
https://mp.weixin.qq.com/s/K2QinpR5Rplw1teHpHtf4w ↩
-
https://nebula-graph.com.cn/posts/detect-corona-virus-spreading-with-graph-database/ ↩
-
https://nebula-graph.com.cn/posts/meituan-graph-database-platform-practice/ ↩
-
https://arxiv.org/abs/1709.03188 ↩