Related technologies
This topic introduces databases and graph-related technologies that are closely related to distributed graph databases.
Databases
Relational databases
A relational database is a database that uses a relational model to organize data. The relational model is a two-dimensional table model, and a relational database consists of two-dimensional tables and the relationships between them. When it comes to relational databases, most people think of MySQL, one of the most popular database management systems that support database operations using the most common structured query language (SQL) and stores data in the form of tables, rows, and columns. This approach to storing data is derived from the relational data model proposed by Edgar Frank Codd in 1970.
In a relational database, a table can be created for each type of data to be stored. For example, the player table is used to store all player information, the team table is used to store team information. Each row of data in a SQL table must contain a primary key. The primary key is a unique identifier for the row of data. Generally, the primary key is self-incrementing with the number of rows as the field ID. Relational databases have served the computer industry very well since their inception and will continue to do so for a long time to come.
If you have used Excel, WPS, or other similar applications, you have a rough idea of how relational databases work. First, you set up the columns, then you add rows of data under the corresponding columns. You can average or otherwise aggregate the data in a column, similar to averaging in a relational database MySQL. Pivot tables in Excel are the equivalent of querying data in a relational database MySQL using aggregation functions and CASE statements. An Excel file can have multiple tables, and a single table is equivalent to a single table in MySQL. An Excel file is similar to a MySQL database.
Relationships in relational databases
Unlike graph databases, edges in relational databases (or SQL-type databases) are also stored as entities in specialized edge tables. Two tables are created, player and team, and then player_team is created as an edge table. Edge tables are usually formed by joining related tables. For example, here the edge table player_team is made by joining the player table and the team table.

The way of storing edges is not a big problem when associating small data sets, but problems arise when there are too many relationships in a relational database. Specifically, when you want to query just one player's teammates, you have to join all the data in the table and then filter out all the data you don't need, which puts a huge strain on the relational database when your dataset reaches a certain size. If you want to associate multiple different tables, the system may not be able to respond before the join bombs.
Origins of relational databases
As mentioned above, the relational data model was first proposed by Edgar Frank Codd, an IBM engineer, in 1970. Codd wrote several papers on database management systems that addressed the potential of the relational data model. The relational data model does not rely on linked lists of data (mesh or hierarchical data), but more on data sets. Using the mathematical method of tuple calculus, he argued that these datasets can perform the same tasks as a navigational database. The only requirement was that the relational data model needed a suitable query language to guarantee the consistency requirements of the database. This became the inspiration for declarative query languages such as Structured Query Language (SQL). IBM's System R was one of the first implementations of such a system. But Software Development Laboratories, a small company founded by ex-IBM people and one illustrious Mr.Larry Ellison, beat IBM to the market with the product that would become known as Oracle.
Since the relational database was a trendy term at the time, many database vendors preferred to use it in their product names, even though their products were not actually relational. To prevent this and reduce the misuse of the relational data model, Codd introduced the famous Codd's 12 Rules. All relational data systems must follow Codd's 12 Rules.
NoSQL databases
Graph databases are not the only alternative that can overcome the shortcomings of relational databases. There are many non-relational database products on the market that can be called NoSQL. The term NoSQL was first introduced in the late 1990s and can be interpreted as "not SQL" or "not only SQL". For the sake of understanding, NoSQL can be interpreted as a "non-relational database" here. Unlike relational databases, the data storage and retrieval mechanisms provided by NoSQL databases are not modeled based on table relationships. NoSQL databases can be divided into four categories.
- Key-value Data Store
- Columnar Store
- Document Store
- Graph Store
The following describes the four types of NoSQL databases.
Key-value Data Store
Key-value databases store data in unique key-value pairs. Unlike relational databases, key-value stores do not have tables and columns. A key-value database itself is like a large table with many columns (i.e., keys). In a key-value store database, data are stored and queried by means of keys, usually implemented as hash lists. This is much simpler than traditional SQL databases, and for some web applications, it is sufficient.
The advantage of the key-value model for IT systems is that it is simple and easy to deploy. In most cases, this type of storage works well for unrelated data. If you are just storing data without querying it, there is no problem using this storage method. However, if the DBA only queries or updates some of the values, the key-value model becomes inefficient. Common key-value storage databases include Redis, Voldemort, and Oracle BDB.
Columnar Store
A NoSQL database's columnar store has many similarities to a NoSQL database's key-value store because the columnar store is still using keys for storage and retrieval. The difference is that in a columnar store database, the column is the smallest storage unit, and each column consists of a key, a value, and a timestamp for version control and conflict resolution. This is particularly useful when scaling in a distributed manner, as timestamps can be used to locate expired data when the database is updated. Because of the good scalability of columnar storage, the columnar store is suitable for very large data sets. Common columnar storage databases include HBase, Cassandra, HadoopDB, etc.
Document Store
A NoSQL database document store is a key-value-based database, but with enhanced functionality. Data is still stored as keys, but the values in a document store are structured documents, not just a string or a single value. That is, because of the increased information structure, document stores are able to perform more optimized queries and make data retrieval easier. Therefore, document stores are particularly well suited for storing, indexing, and managing document-oriented data or similar semi-structured data.
Technically speaking, as a semi-structured unit of information, a document in a document store can be any form of document available, including XML, JSON, YAML, etc., depending on the design of the database vendor. For example, JSON is a common choice. While JSON is not the best choice for structured data, JSON-type data can be used in both front-end and back-end applications. Common document storage databases include MongoDB, CouchDB, Terrastore, etc.
Graph Store
The last class of NoSQL databases is graph databases. NebulaGraph, is also a graph database. Although graph databases are also NoSQL databases, graph databases are fundamentally different from the above-mentioned NoSQL databases. Graph databases store data in the form of points, edges, and attributes. Its advantages include high flexibility, support for complex graph algorithms, and can be used to build complex relational graphs. We will discuss graph databases in detail in the subsequent topics. But in this topic, you just need to know that a graph database is a NoSQL type of database. Common graph databases include NebulaGraph, Neo4j, OrientDB, etc.
Graph-related technologies
Take a look at a panoramic view of graph technology in 2020 1.

There are many technologies that are related to graphs, which can be broadly classified into these categories:
- Infrastructure: including graph databases, graph computing (processing) engines, graph deep learning, cloud services, etc.
- Applications: including visualization, knowledge graph, anti-fraud, cyber security, social network, etc.
- Development tools: including graph query languages, modeling tools, development frameworks, and libraries.
- E-books 2 and conferences, etc.
Graph language
In the previous topic, we introduced the history of graph languages. In this section, we make a classification of the functions of graph languages.
- Nearest neighbor query (NNS): Query the neighboring edges, neighbors, or K-hops neighbors.
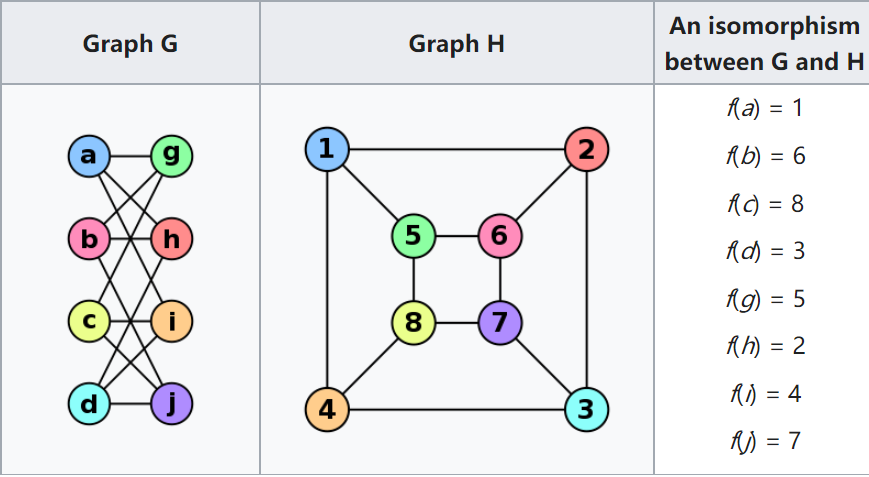
- Find one/all subgraphs that satisfy a given graph pattern. This problem is very close to Subgraph Isomorphism - two seemingly different graphs that are actually identical [ ^subiso] as shown below.
- Reachability (connectivity) problems: The most common reachability problem is the shortest path problem. Such problems are usually described in terms of Regular Path Query - a series of connected groups of vertices forming a path that needs to satisfy some regular expression.
- Analytic problems: It is related to some convergent operators, such as Average, Count, Max, Vertex Degree. Measures the distance between all two vertices, the degree of interaction between a vertex and other vertices.
Graph database and graph processing systems
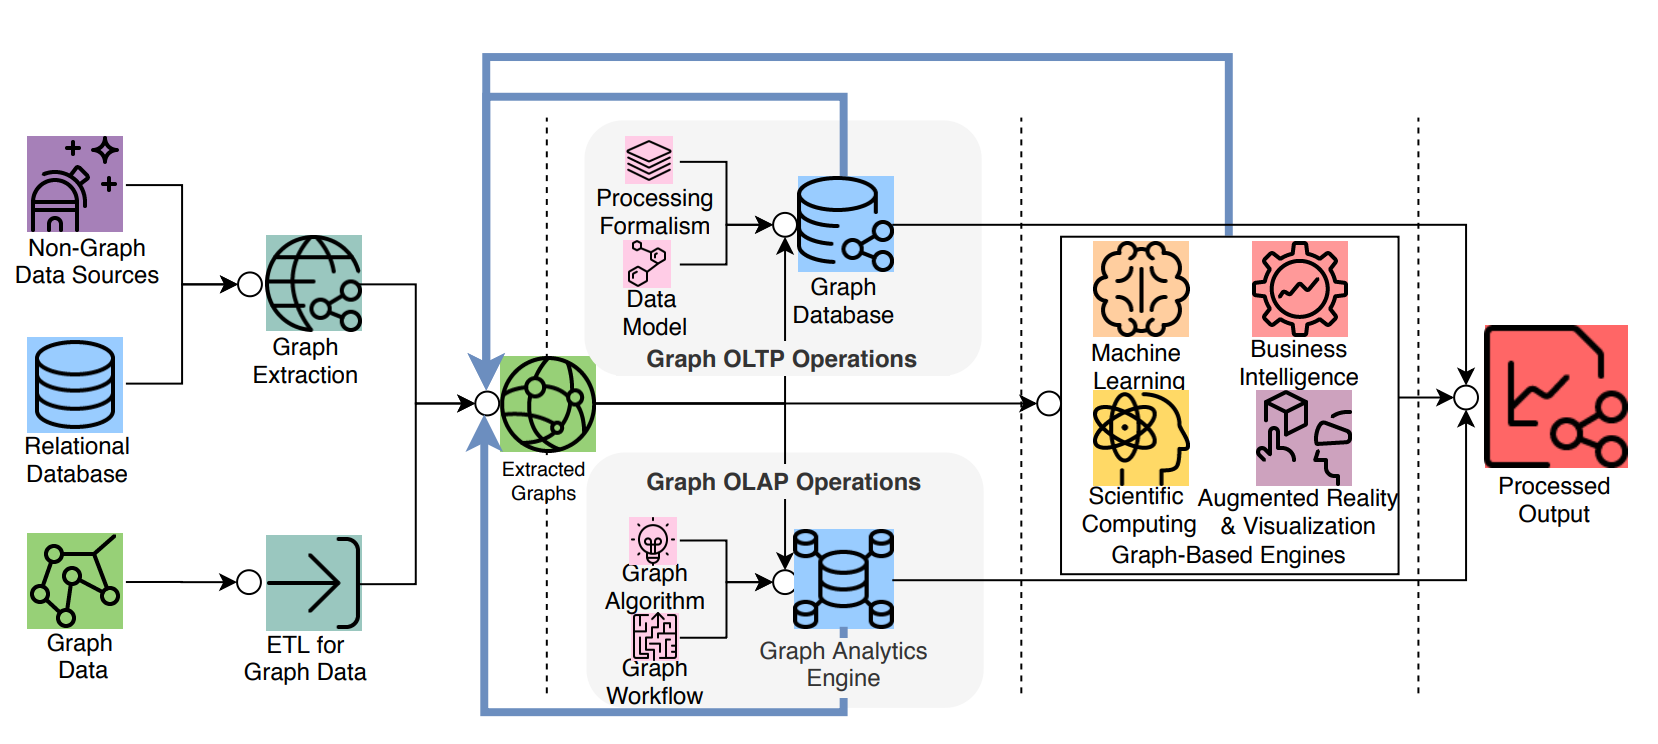
A graph system usually includes a complex data pipeline 4. From the data source (the left side of the picture below) to the processing output (the right side), multiple data processing steps and systems are used, such as the ETL module, Graph OLTP module, OLAP module, BI, and knowledge graph.
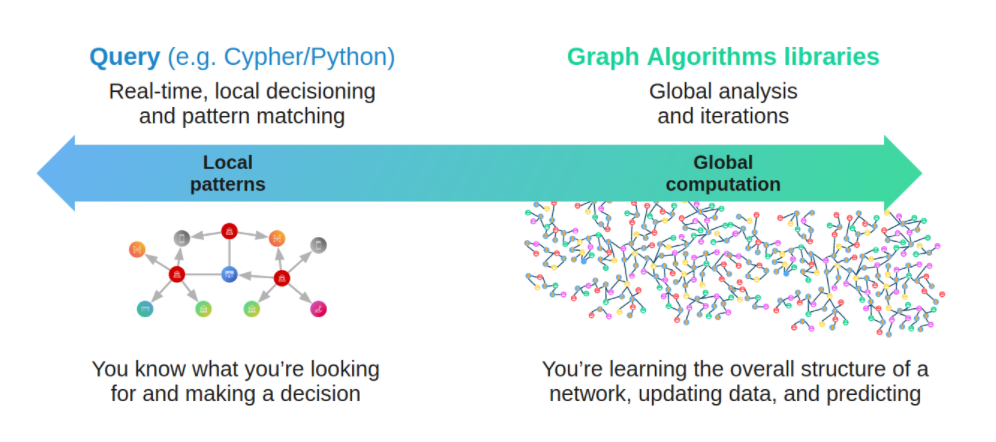
Graph databases and graph processing systems have different origins and specialties (and weaknesses).
- (Online) The graph database is designed for persistent storage management of graphs and efficient subgraph operations. Hard disks and network) are the target operating devices, physical/logical data mapping, data integrity, and (fault) consistency are the main goals. Each request typically involves only a small part of the full graph and can usually be done on a single server. Request latency is usually in milliseconds or seconds, and request concurrency is typically in the thousands or hundreds of thousands. The early Neo4j was one of the origins of the graph database space.
- (Offline) The graph processing system is for high-volume, parallel, iterative, processing, and analysis of the full graph. Memory and network are the target operating devices. Each request involves all graph vertices and requires all servers to be involved in its completion. The latency of a single request is in the range of minutes to hours (days). The request concurrency is in single digits. Google's Pregel 5 represents the typical origin of graph processing systems. Its point-centric programming abstraction and BSP's operational model constitute a programming paradigm that is a more graph-friendly API abstraction than the previous Hadoop Map-Reduce.
Graph sharding methods
For large-scale graph data, it is difficult to store it in the memory of a single server, and even just storing the graph structure itself is not enough. By increasing the capacity of a single server, its cost price usually rises exponentially.
As the volume of data increases, for example, 100 billion data already exceeds the capacity of all commercially available servers on the market.
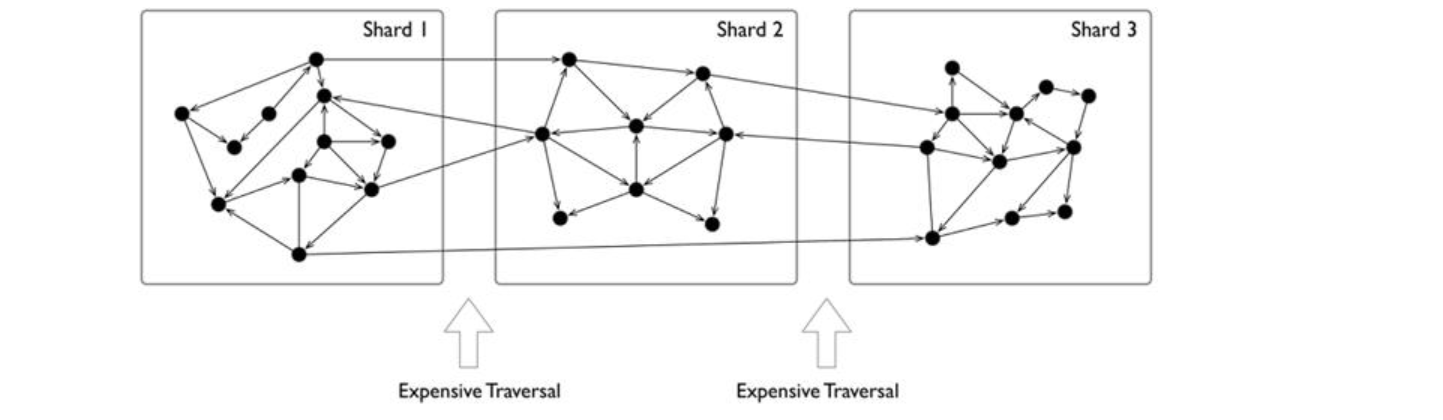
There is another option is to shard data and place each shard on a different server to increase reliability and performance. For NoSQL systems, such as key-value or document systems, the sharding method is intuitive and natural. Each record and data unit can usually be placed on a different server based on the key or docID.
However, the sharding of data structures like graphs is usually less intuitive, because usually, graphs are "fully connected" and each vertex can be connected to any other vertex in usually 6 hops.
And it has been theoretically proven that the graph sharding problem is NP.
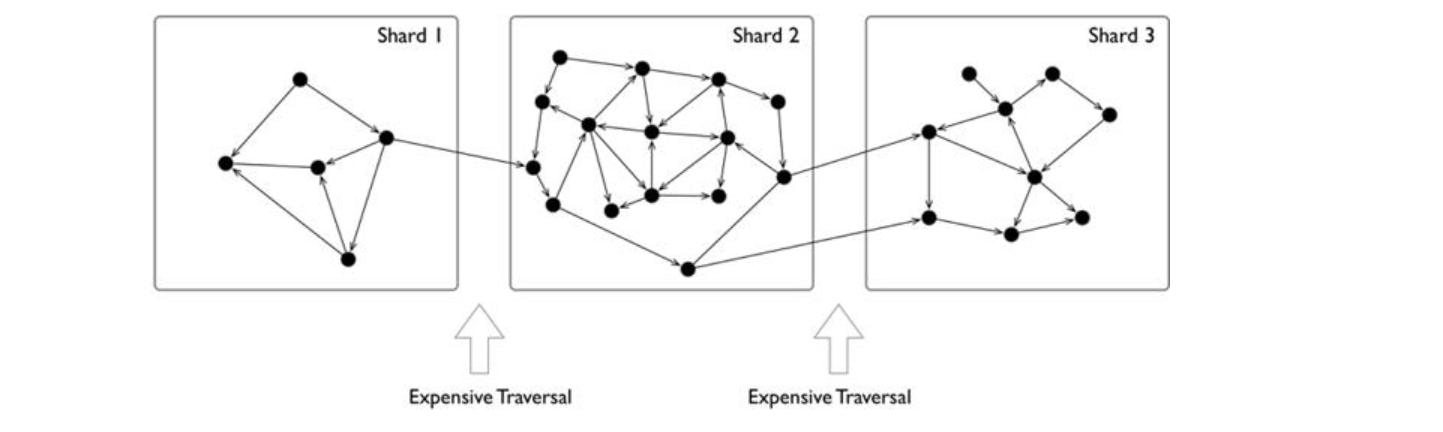
When distributing the entire graph data across multiple servers, the cross-server network access latency is 10 times higher than the hardware (memory) access time inside the same server. Therefore, for some depth-first traversal scenarios, a large number of cross-network accesses occur, resulting in extremely high overall latency.
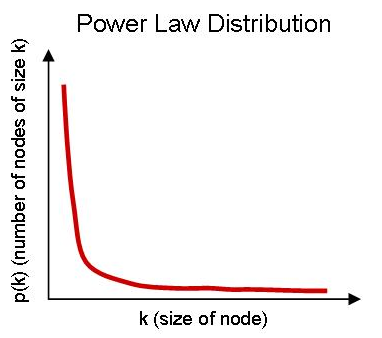
Usually, graphs have a clear power-law distribution. A small number of vertices have much denser neighboring edges than the average vertices. While processing these vertices can usually be within the same server, reducing cross-network access, also means that these servers will be far more stressed than the average.
The common graph sharding methods are as follows:
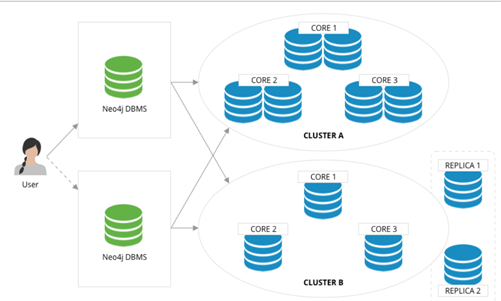
- Biased application-level sharding: The application layer senses and controls which shard each vertex and edge should locate on, which can generally be judged based on the type of points and edges. A set of vertices of the same type is placed on one sharding and another set of vertices of the same type is placed on another sharding. Of course, for high reliability, the sharding itself can also be made multiple copies. When used by the application, the desired vertices and edges are fetched from each shard, and then on the off-application side (or some proxy server-side), the fetched data is assembled into the final result. This is typically represented by the Neo4j 4. x Fabric.
- Using a distributed cache layer: Add a memory cache layer on the top of the hard disk and cache important portions of the sharding and data and preheat that cache.
- Adding read-only replicas or views: Add read-only replicas or create a view for some of the graph sharding, and pass the heavier load of read requests through these sharding servers.
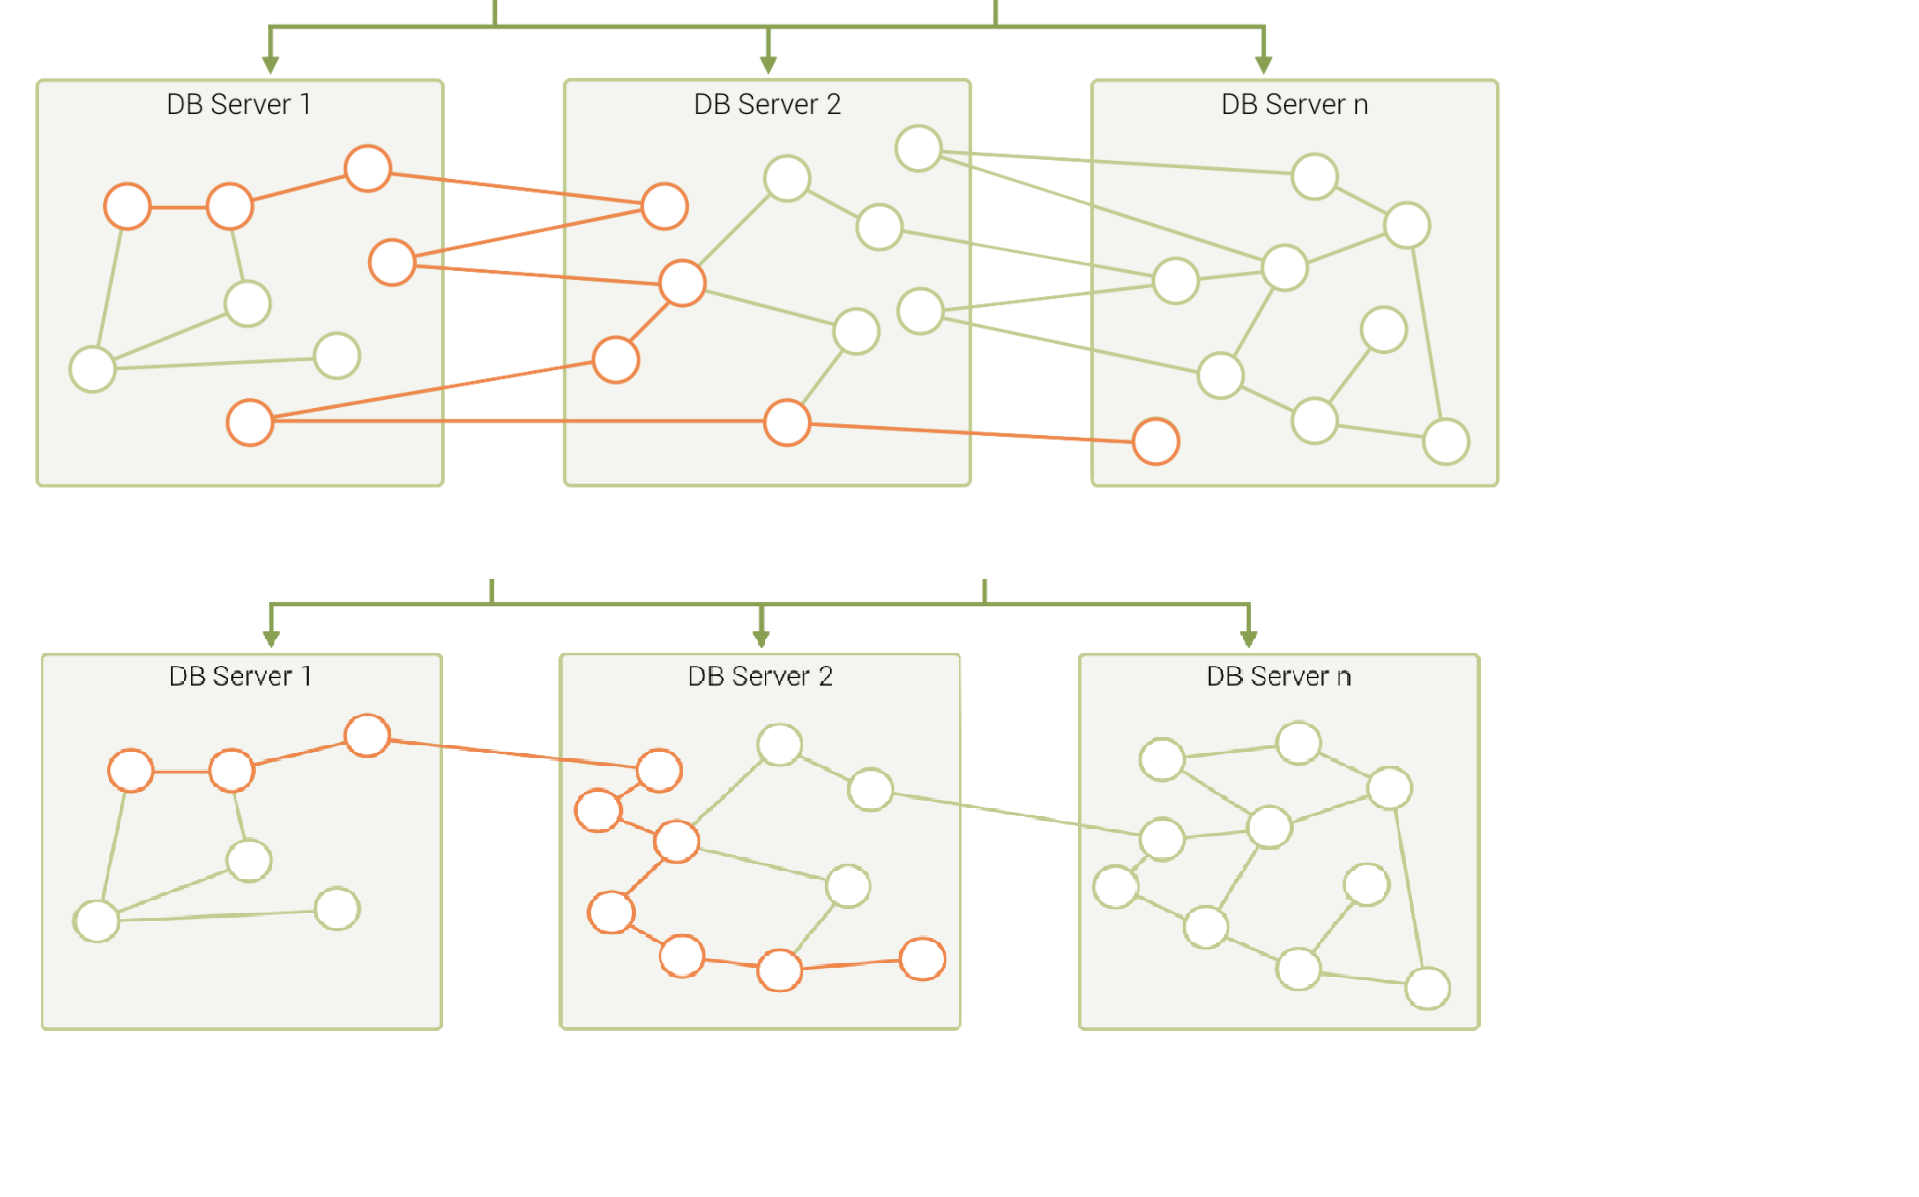
- Performing fine-grained graph sharding: Form multiple small partitions of vertices and edges instead of one large sharding, and then place the more correlated partitions on the same server as much as possible. 8。
A mixture of these approaches is also used in specific engineering practices. Usually, offline graph processing systems perform some degree of graph preprocessing to improve the locality through an ETL process, while online graph database systems usually choose a periodic data rebalancing process to improve data locality.
Technical challenges
In the literature 9, a thorough investigation of graphs and challenges is done, and the following lists the top ten graph technology challenges.
- Scalability: Loading and upgrading big graphs, performing graph computation and graph traversal, use of triggers and supernodes.
- Visualization: Customizable layouts, rendering and display big images, and display dynamic and updated display.
- Query language and programming API: Language expressiveness, standards compatibility, compatibility with existing systems, design of subqueries, and associative queries across multiple graphs.
- Faster graph algorithms.
- Easy to use (configuration and usage)
- Performance metrics and testing
- General graph technology software (e.g., to handle offline, online, streaming computations.)
- ETL
- Debug and test
Open-source graph tools on single machines
There is a common misconception about graph databases that any data access involving graph structure needs to be stored in a graph database.
When the amount of data is not large, single machine memory is enough to store the data. You can use some single machine open-source tools to store tens of millions of vertices and edges.
- JGraphT10: A well-known open-source Java graph theory library, which implements a considerable number of efficient graph algorithms.
- igraph11: A lightweight and powerful library, supporting R, Python, and C++.
- NetworkX12: The first choice for data scientists doing graph theory analysis.
- Cytoscape13: A powerful visual open-source graph analysis tool.
- Gephi14: A powerful visual open-source graph analysis tool.
- arrows.app15: A simple brain mapping tool for visually generating Cypher statements.
Industry databases and benchmarks
LDBC
LDBC16 (Linked Data Benchmark Council)is a non-profit organization composed of hardware and software giants such as Oracle, Intel and mainstream graph database vendors such as Neo4j and TigerGraph, which is the benchmark guide developer and test result publisher for graphs and has a high influence in the industry.
SNB (Social Network Benchmark)is one of the benchmarks developed by the Linked Data Benchmark Committee (LDBC) for graph databases and is divided into two scenarios: interactive query (Interactive) and business intelligence (BI). Its role is similar to that of TPC-C, TPC-H, and other tests in SQL-type databases, which can help users compare the functions, performance, and capacity of various graph database products.
An SNB dataset simulates the relationship between people and posts of a social network, taking into account the distribution properties of the social network, the activity of people, and other social information.
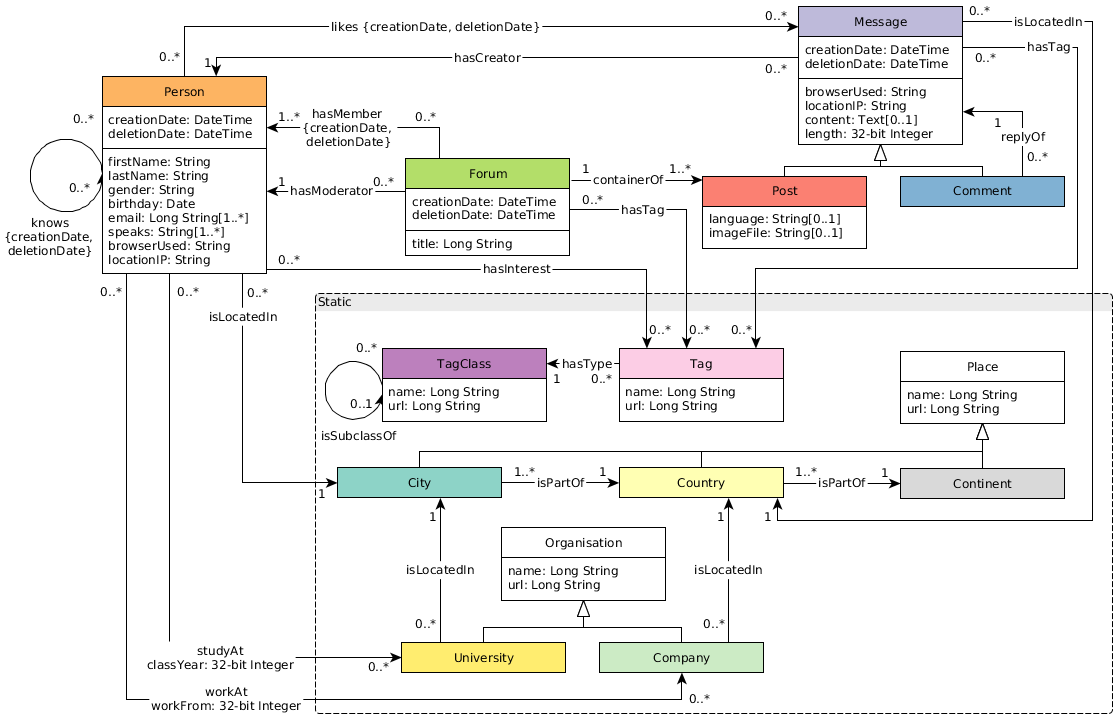
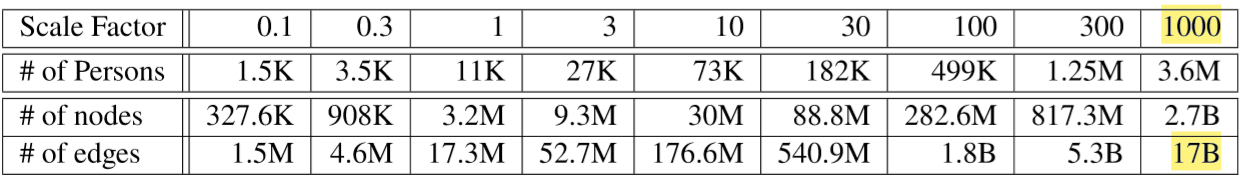
The standard data size ranges from 0.1 GB (scale factor 0.1) to 1000 GB (sf 1000). Larger data sets of 10 TB and 100 TB can also be generated. The number of vertices and edges is as shown below.
Trends
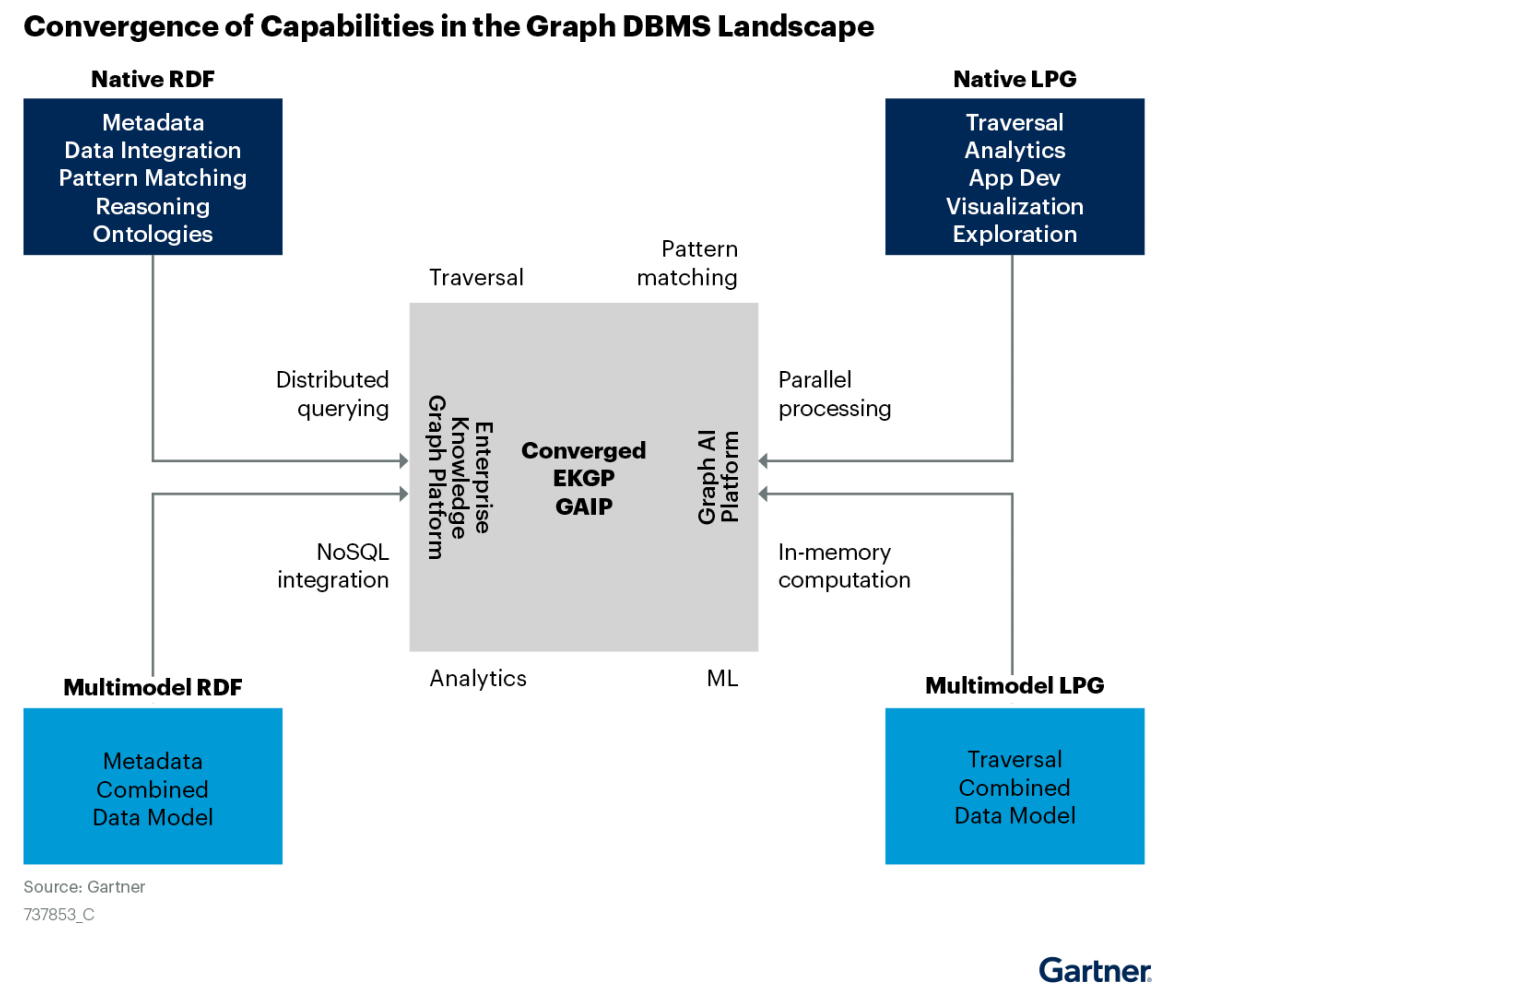
Graph technologies of different origins and goals are learning from and integrating with each other
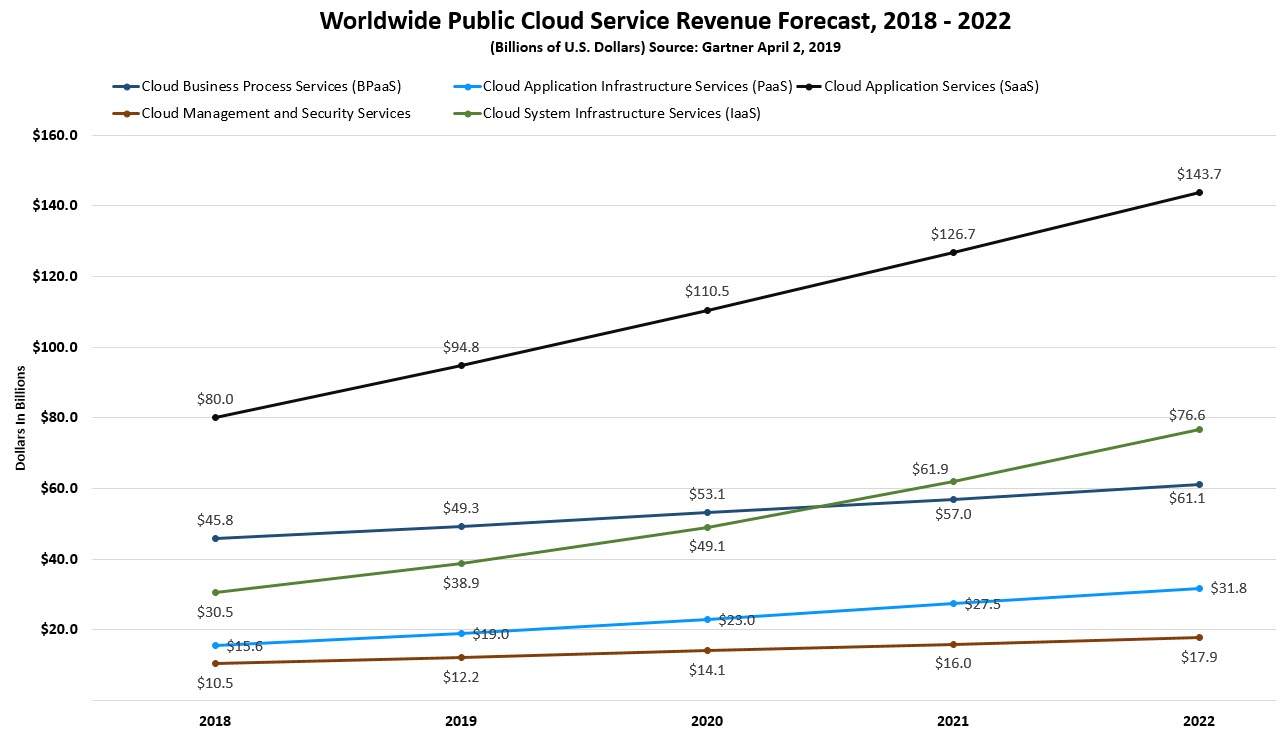
The trends in cloud computing place higher demands on scalability.
According to Gartner's projections, cloud services have been growing at a rapid rate and penetration 17. A large number of commercial software is gradually moving from a completely local and private model 10 years ago to a cloud services-based business model. One of the major advantages of cloud services is that they offer near-infinite scalability. It requires that various cloud infrastructure-based software must have a better ability to scale up and down quickly and elastically.
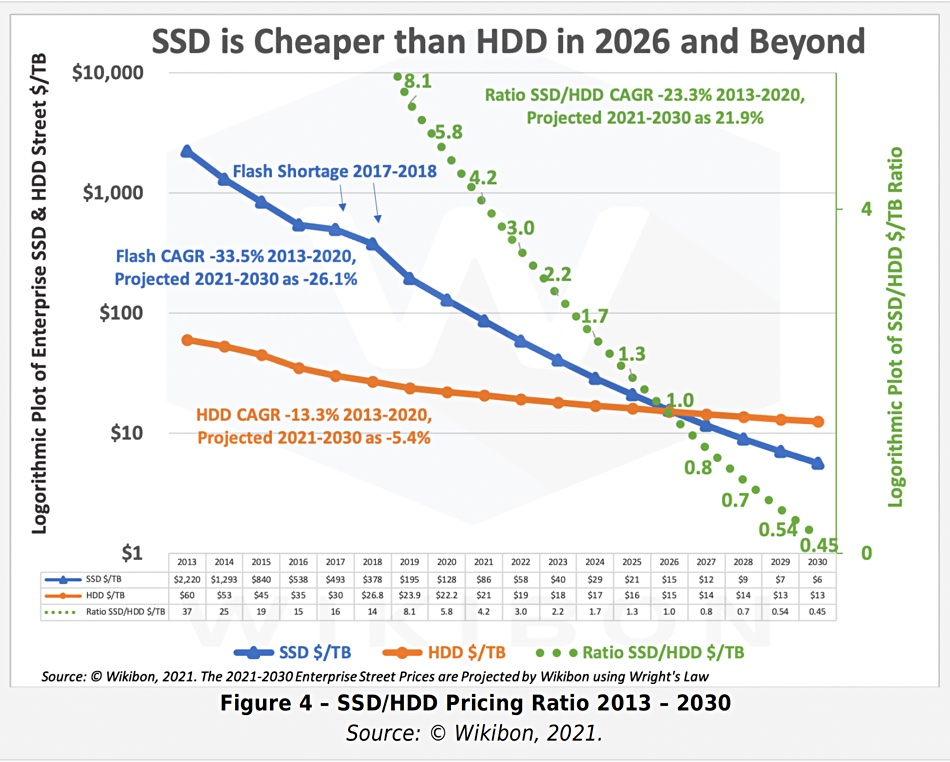
Trends in hardware that SSD will be the mainstream persistent device
Hardware determines software architecture. From the 1950s, when Moore's Law was discovered, to the 00s, when multi-core was introduced, hardware trends and speeds have profoundly determined software architecture. Database systems are mostly designed around "hard disk + memory", high-performance computing systems are mostly designed around "memory + CPU", and distributed systems are designed completely differently for 1 gigabit, 10 gigabits, and RDMA.
Graph traversals are featured as random access. Early graph database systems adopted the large memory + HDD architecture. By designing some data structure in memory, random access can be achieved in memory (B+ trees, Hash tables) for the purpose of optimizing graph topology traversal. And then the random access was converted into sequential reads and writes suitable for HDDs. The entire software architecture (including the storage and compute layers) must be based on and built around such IO processes. With the decline in SSD prices 18, SSDs are replacing HDDs as the dominant device. Friendly random access, deep IO queue, fast access are the features of SSD that differ from HDD's highly repetitive sequence, random latency, and easily damaged disk. The redesign for all software architectures becomes a heavy historical technical burden.
-
https://graphaware.com/graphaware/2020/02/17/graph-technology-landscape-2020.html ↩
-
Electronic copies are available for learning purposes by contacting Author. ↩
-
https://en.wikipedia.org/wiki/Graph_isomorphism ↩
-
The Future is Big Graphs! A Community View on Graph Processing Systems. https://arxiv.org/abs/2012.06171 ↩
-
G. Malewicz, M. H. Austern, A. J. Bik, J. C. Dehnert, I. Horn, N. Leiser, and G. Czajkowski. Pregel: a system for large-scale graph processing. In Proceedings of the International Conference on Management of data (SIGMOD), pages 135–146, New York, NY, USA, 2010. ACM ↩
-
https://neo4j.com/graphacademy/training-iga-40/02-iga-40-overview-of-graph-algorithms/ ↩
-
https://livebook.manning.com/book/graph-powered-machine-learning/welcome/v-8/ ↩
-
https://www.arangodb.com/learn/graphs/using-smartgraphs-arangodb/ ↩
-
https://arxiv.org/abs/1709.03188 ↩
-
https://jgrapht.org/ ↩
-
https://igraph.org/ ↩
-
https://networkx.org/ ↩
-
https://cytoscape.org/ ↩
-
https://gephi.org/ ↩
-
https://arrows.app/ ↩
-
https://github.com/ldbc/ldbc_snb_docs ↩
-
https://cloudcomputing-news.net/news/2019/apr/15/public-cloud-soaring-to-331b-by-2022-according-to-gartner/ ↩
-
https://blocksandfiles.com/2021/01/25/wikibon-ssds-vs-hard-drives-wrights-law/ ↩