Cluster overview
This topic introduces the Overview page of Dashboard. You can click Detail on the right of the cluster management page to check the overview of a specified cluster.
Overview
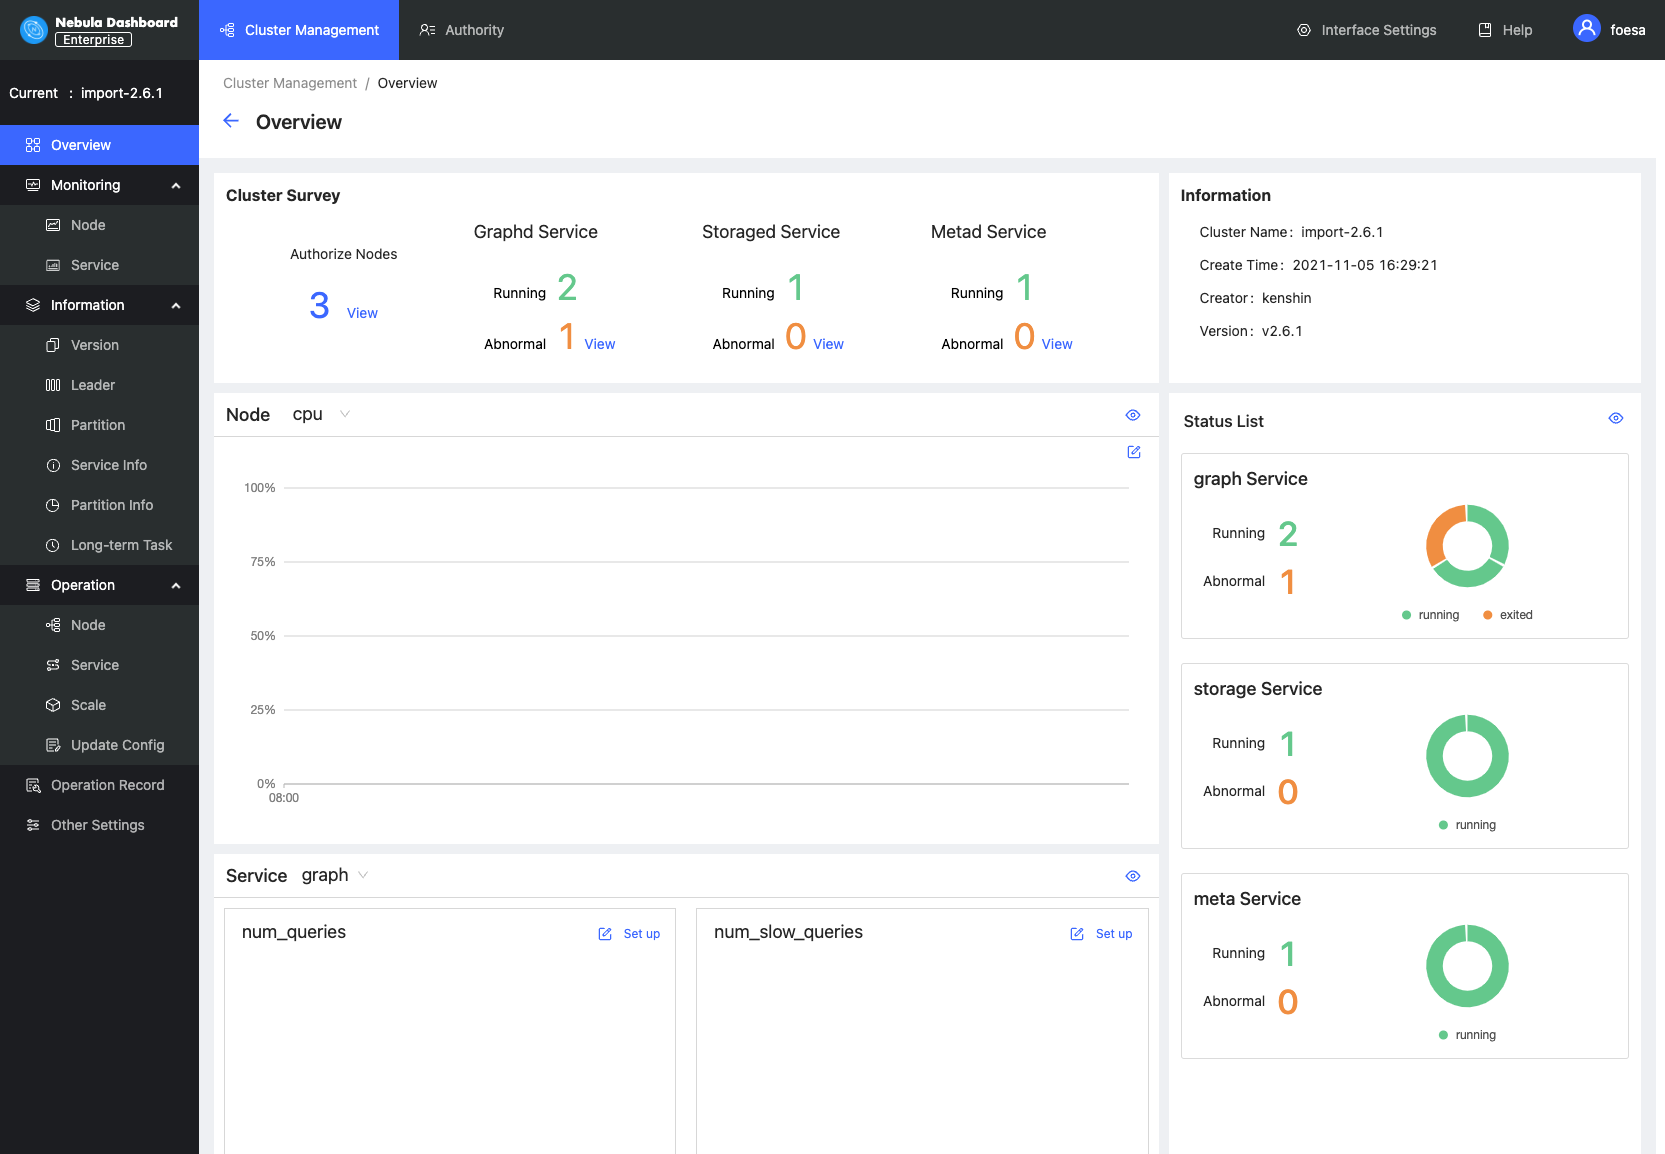
The Overview page has five parts:
- Cluster survey
- Information
- Node
- Status list
- Service
Cluster survey
In this part, you can view the number of nodes as well as the number of running and abnormal services of Graphd, Storaged, and Metad. In this example, there is 1 abnormal service in the Graphd service. You can click the View button to quickly check the abnormal service.
Information
In this part, you can view the information of Cluster name, Creation time, Creator, and Version.
Note
The version here is the NebulaGraph version installed by the user, not the Dashboard version.
Caution
If the version of NebulaGraph imported by the user is before v2.5.0 or the version is unknown, v2.0.1 will be shown by default.
Node
- You can view the information of node monitoring quickly and change the displayed information. By default, the CPU information will be shown.
- You can click
 on the page to insert a base line.
 - You can click
 to jump to the detailed node monitoring page.
Status list
This part uses pie charts to visually display the running status of nodes.
Service
- By default, the information of
query_latency_usandslow_query_latency_uswill be shown.
- You can click Set up to insert a base line.
- You can click View to jump to the detailed service monitoring page.