Deploy Dashboard
This topic will introduce how to install and deploy Dashboard in detail.
Prerequisites
Before deploying Dashboard, you must do a check of these:
- Select and download Dashboard of the correct version. For information about the version correspondence between Dashboard and NebulaGraph, see Version compatibility.
- The environment of MySQL is ready and a database named as
dashboardis created. -
Before the installation starts, the following ports are not occupied.
Port Description 7005 The port through which Dashboard provides the web service. 8090 The port of the nebula-http-gateway service. 9090 The port of the prometheus service. 9200 The port of the nebula-stats-exporter service.
-
The license is ready.
Enterpriseonly
The license is only available in the Enterprise Edition. To obtain the license, send email to inquiry@vesoft.com.
Install and start
-
Select and download the tar package according to your needs. It is recommended to select the latest version.
Enterpriseonly
For features of Dashboard Enterprise Edition, see Pricing.
-
Use
tar -xzvfto decompress the tar package.$ tar -xzvf nebula-dashboard-ent-<version>.linux-amd64.tar.gzFor example:
$ tar -xzvf nebula-dashboard-ent-1.0.0.linux-amd64.tar.gz -
Edit
vim config/config.yamlto modify the configuration.# Information about the database database: dialect: mysql # The type of database used, which currently only supports MySql host: 192.168.8.157 # The IP address of the connected MySql database port: 3306 # The port of the connected MySql database username: root # The username to log in MySql password: nebula # The password to log in MySql name: dashboard # The name of the corresponding database autoMigrate: true # Auto database tables creation, the default value of which is true # Information about the exporter port exporter: nodePort: 9100 # The port of the node-exporter service nebulaPort: 9200 # The port of the nebula-stats-exporter service # Information of services proxy: gateway: target: "127.0.0.1:8090" # The IP address and port of the gateway service prometheus: target: "127.0.0.1:9090" # The IP address and port of the prometheus service -
Copy the license file to the
nebula-dashboard-entdirectory.$ cp -r <license> <dashboard_path>For example:
$ cp -r nebula.license /usr/local/nebula-dashboard-ent -
Start Dashboard.
You can use the following command to start the Dashboard with one click.
$ cd scripts
$ sudo ./dashboard.service start all
Or execute the following commands to start prometheus, webserver, exporter and gateway services to start Dashboard.
$ cd scripts
$ sudo ./dashboard.service start prometheus # Start prometheus service
$ sudo ./dashboard.service start webserver # Start webserver service
$ sudo ./dashboard.service start exporter # Start exporter service
$ sudo ./dashboard.service start gateway # Start gateway service
Manage Dashboard Service
You can use the dashboard.service script to start, stop, and check the Dashboard services.
Syntax
$ sudo <dashboard_path>/dashboard/scripts/dashboard.service
[-v] [-h]
<start|stop|status>  <prometheus|webserver|exporter|gateway|all>
| Parameter | Description |
|---|---|
dashboard_path |
Dashboard installation path. |
-v |
Display detailed debugging information. |
-h |
Display help information. |
start |
Start the target services. |
stop |
Stop the target services. |
status |
Check the status of the target services. |
prometheus |
Set the prometheus Service as the target service. |
webserver |
Set the webserver Service as the target service. |
exporter |
Set the exporter Service as the target service. |
gateway |
Set the gateway Service as the target service. |
all |
Set all the Dashboard services as the target services. |
Examples
Dashboard is installed in the current directory, and you can use the following commands to manage services.
$ sudo /dashboard/scripts/dashboard.service start all #start all Dashboard service
$ sudo /dashboard/scripts/dashboard.service stop all #stop all Dashboard service
$ sudo /dashboard/scripts/dashboard.service status all #check all Dashboard service
Next to do
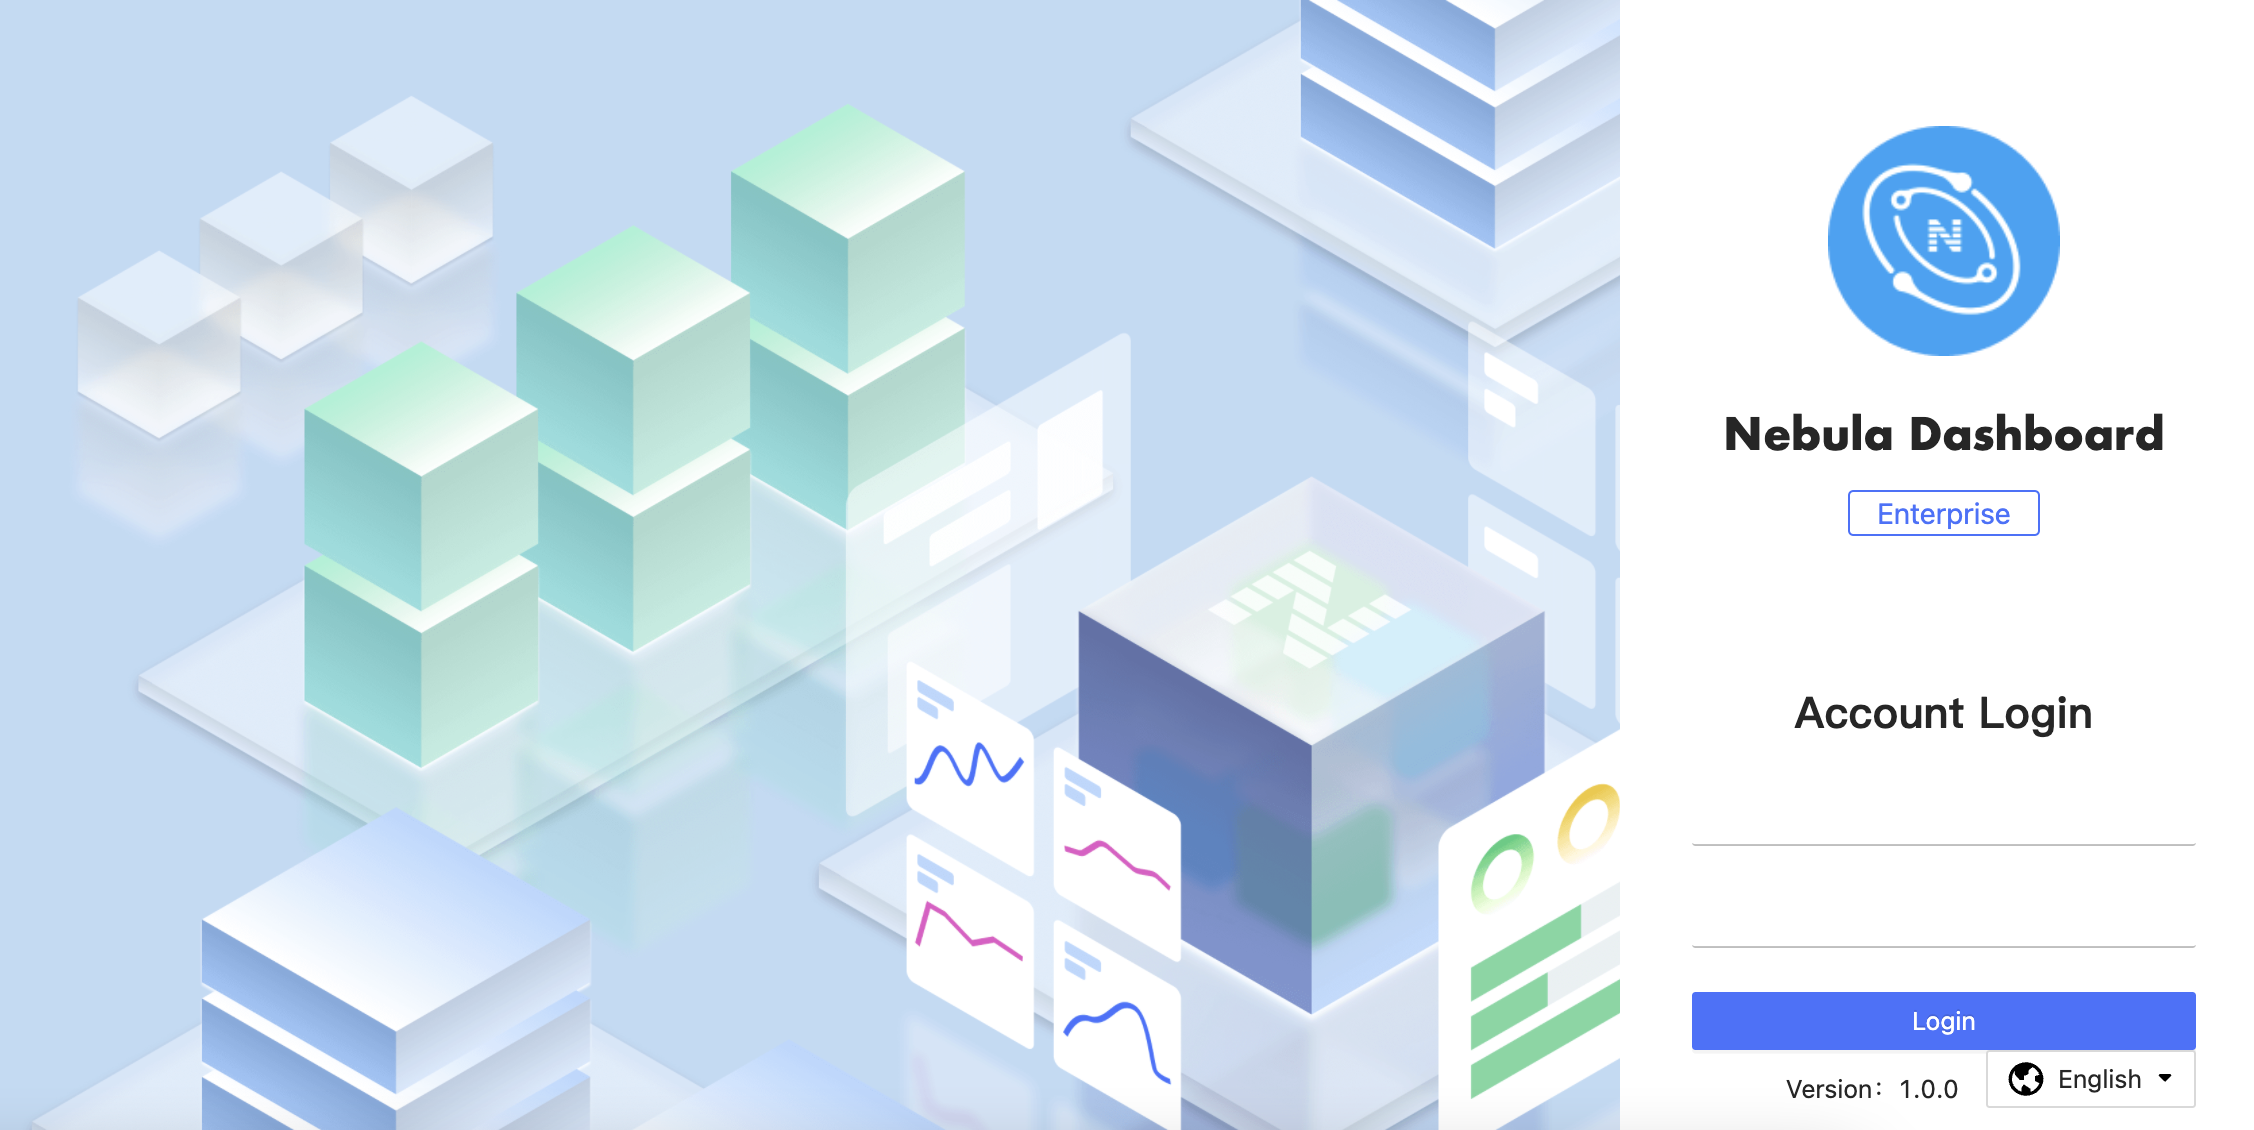
After Dashboard is successfully started, you can enter http://<ip_address>:7005 in the address bar of a browser.
If the following login interface is shown in the browser, then you have successfully deployed and started Dashboard. You can log into Dashboard as a GOD user with the default username nebula and password nebula. You can modify the password in System Settings. And you also can use the GOD account to create a new account with the permission ADMIN on the Account Management to log into the Dashboard.
