View subgraphs
With the View Subgraphs function, you can run a FIND SHORTEST | ALL PATH statement on the Console page to retrieve all the paths or the shortest path between the specified vertices and then view the result on the Explore page.
For more information about FIND SHORTEST | ALL PATH, see nGQL User Guide.
Studio version
Studio of v1.2.1-beta or later versions supports this function. To update the version, run this command.
$ docker-compose pull && docker-compose up -d
Prerequisites
To use the View Subgraphs function, you must do a check of these:
- The version of Studio is v1.2.1-beta or later.
- Studio is connected to Nebula Graph.
- A dataset exists in the database. In the example of this article, the mooc_actions dataset is used. For more information, see Import data.
Procedure
To query the paths on the Console page and then view them on the Explore page, follow these steps:
- In the navigation bar, click the Console tab.
- In the Current Graph Space dropdown list, choose a graph space name. In this example, mooc_actions is chosen.
-
In the input box, enter a
FIND SHORTEST PATHorFIND ALL PATHstatement and click Run .
.Here is an nGQL statement example.
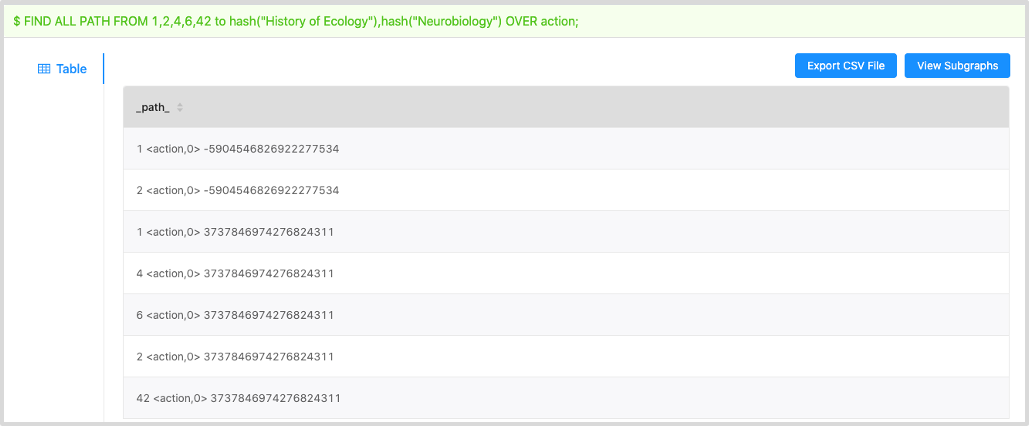
nebula> FIND ALL PATH FROM 1,2,4,6,42 to hash("History of Ecology"),hash("Neurobiology") OVER action; -- For the mooc_actions dataset, the VIDs of the course vertices are generated by the hash("<courseName>") function.The queried result gives all the paths from the specified user vertices to the course vertices, as shown in this figure.

-
Click the View Subgraphs button.
- (Optional) If some data exists on the board of Explore, choose a method to insert data:
- Incremental Insertion: Click this button to add the result to the existing data on the board. - Insert After Clear: Click this button to clear the existing data from the board and then add the data to the board.
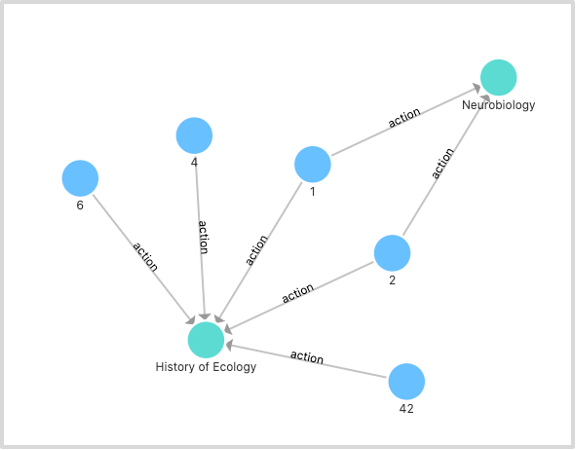
When the data is inserted, you can view the visualized representation of the paths.

Next to do
On the Explore page, you can expand the graph to explore and analyze graph data.