Dashboard
Nebula Dashboard consists of three parts: Machine, Service, and Management. This topic will describe them in detail.
Overview
Machine
Machine consists of the following parts:
-
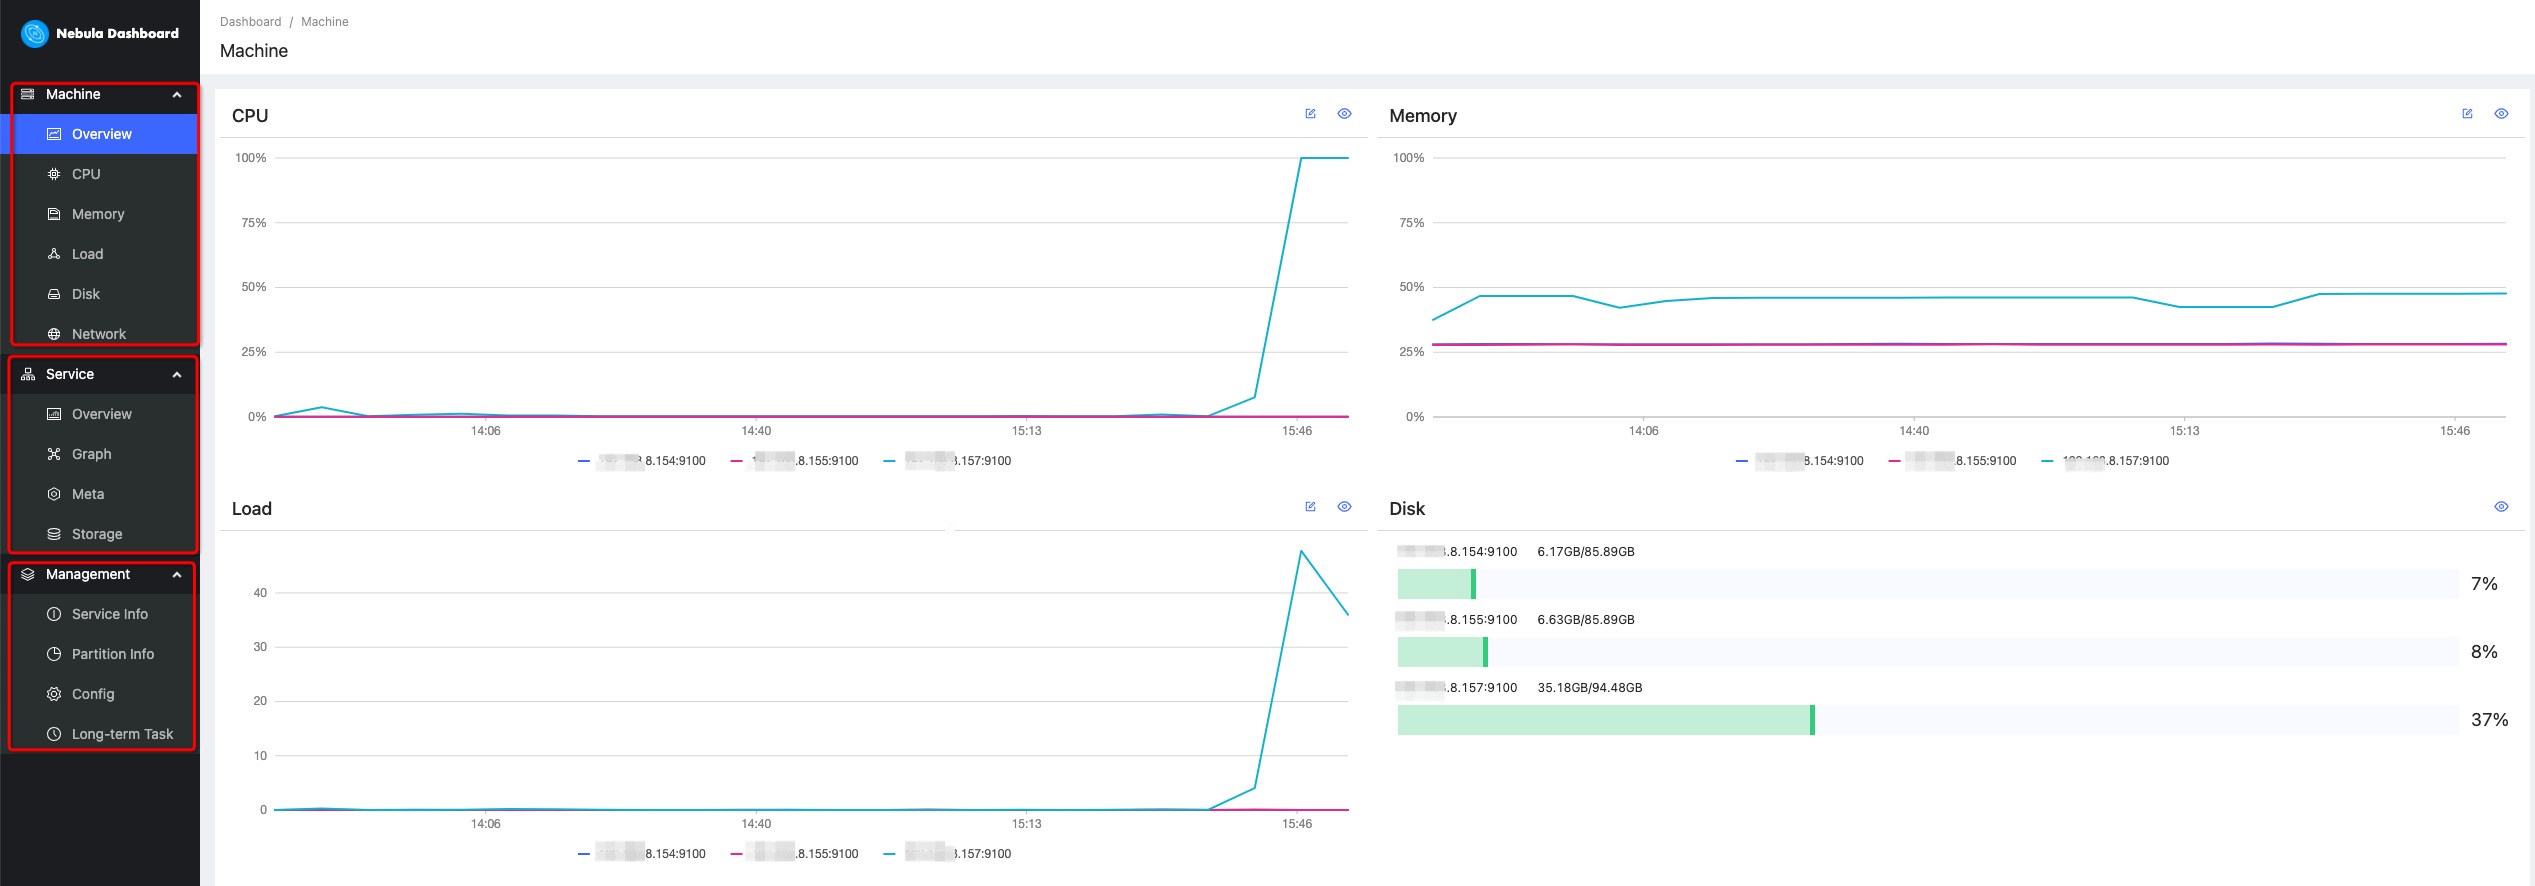
Overview
You can check the fluctuations of CPU, Memory, Load, Disk, Network In, and Network Out in the past 24 hours.
For details of certain monitoring metrics, you can click the
 symbol in the upper right corner, or click the monitoring metrics on the left.
-
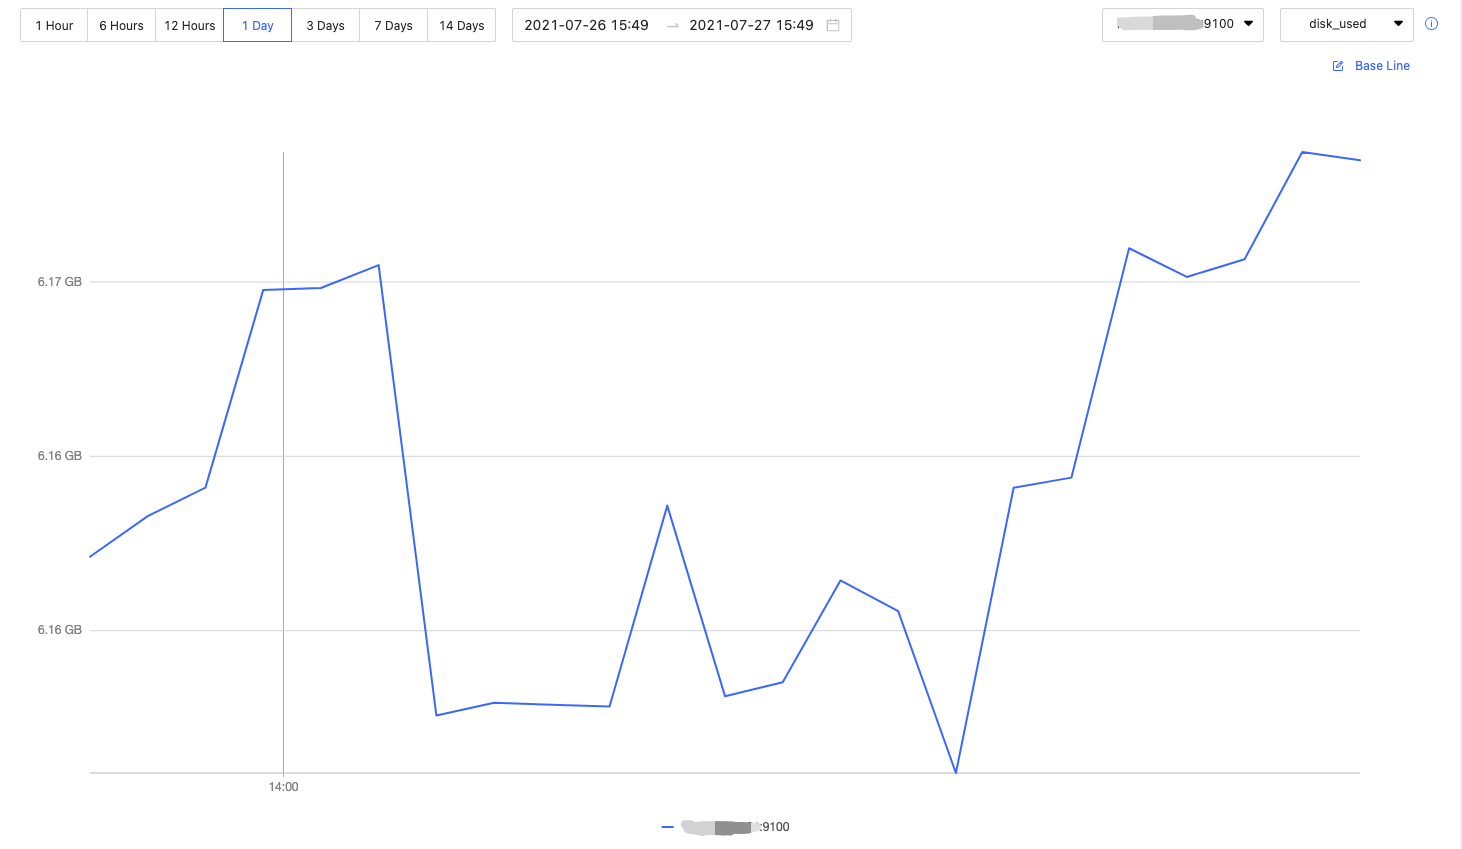
CPU, Memory, Load, Disk, Network
It shows the detailed monitoring data of the machine from the above dimensions.
- By default, you can check the monitoring data up to 14 days before. The alternative can be 1 hour, 6 hours, 12 hours, 1 day, 3 days, 7 days, or 14 days in the past.
- You can choose the machine and monitoring metrics that you want to check. For more information, see monitor parameter.
- The Graph service supports a set of graph space metrics. For details, see Graph space.
- You can set a base line as a reference.
Service
Service consists of the following parts:
-
Overview
You can check the fluctuations of monitoring metrics of various services in the past 24 hours. You can also switch to the Version page to view the IP addresses and versions of all services.
For details of certain monitoring metrics, you can click the
symbol in the upper right corner, or click the services on the left.Note
The overview page of the current Community Edition only supports setting two monitoring metrics for each service. You can adjust it by clicking the Set up button.
-
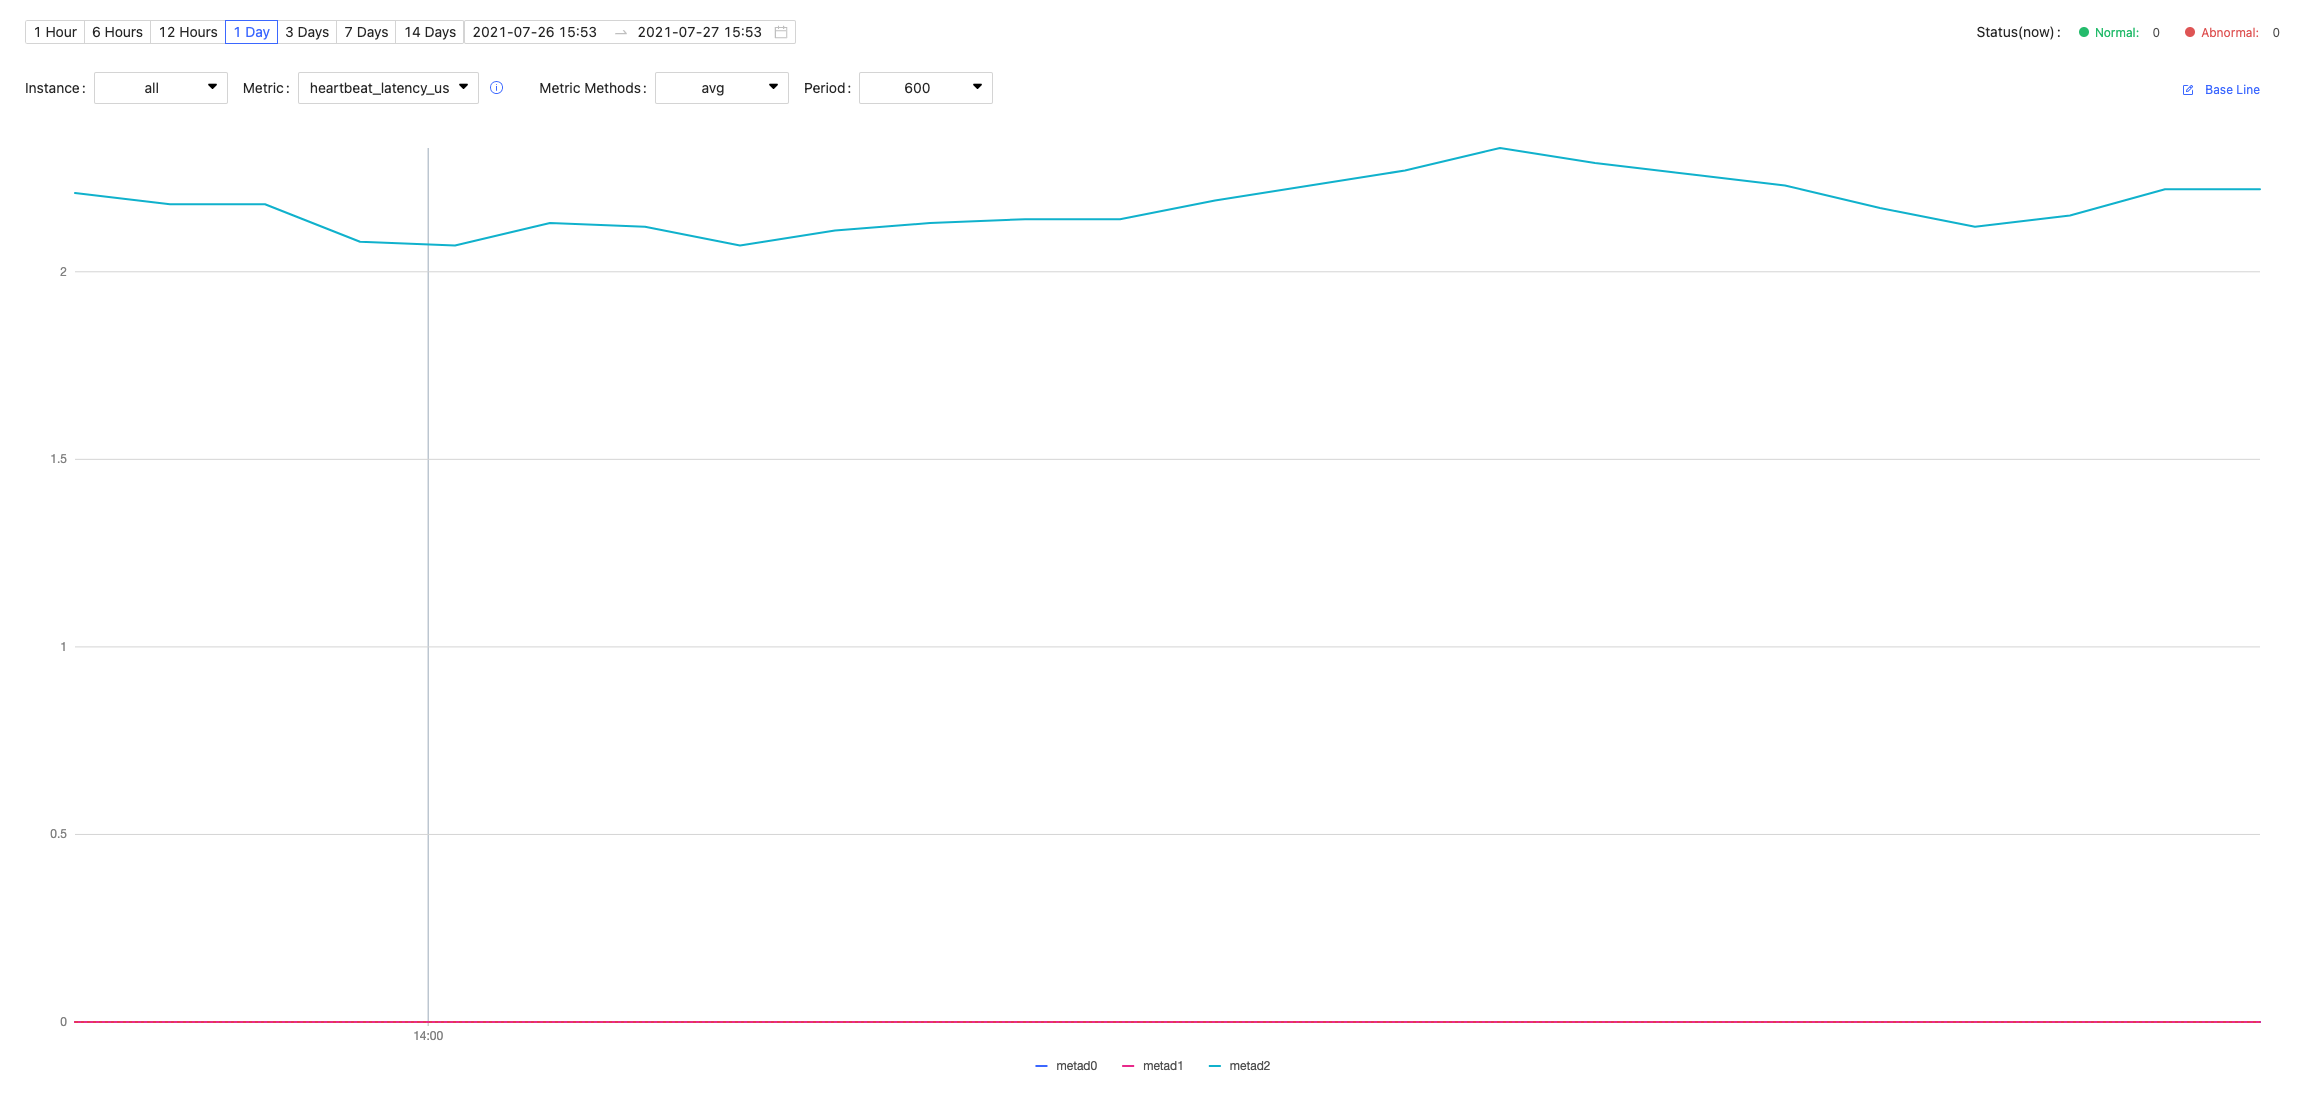
Graph, Meta, Storage
It shows the detailed monitoring data of the above services.
- By default, you can check the monitoring data up to 14 days before. The alternative can be 1 hour, 6 hours, 12 hours, 1 day, 3 days, 7 days, or 14 days in the past.
- You can choose the machine that you want to check the monitoring data, monitoring metrics, metric methods, and period. For more information, see monitor parameter.
- You can set a base line as a reference.
- You can check the status of the current service.
Management
Note
Non-root users can view the service information and the partition information with spatial permissions, but cannot view the configuration and long-term tasks.
Management consists of the following parts:
-
Service Info
It shows the basic information of the Storage Service, including the information of the host, the commit ID of versions, the number of leaders, the distribution of partitions, and the distribution of leaders.
-
Partition Info
You can check the information of partitions in different graph spaces. The descriptions are as follows.
Parameter Description Partition IDThe ID of the partition. LeaderThe IP address and the port of the leader. PeersThe IP addresses and the ports of all the replicas. LostsThe IP addresses and the ports of replicas at fault.
-
Config
It shows the configuration of each service. Dashboard does not support online modification of configurations for now. For details, see configurations.
-
Long-term Task
It shows the information of all jobs. Dashboard does not support online management of jobs for now. For details, see job statements.
Others
In the lower left corner of the page, you can:
- Sign out
- Switch between Chinese and English
- View the current Dashboard release
- View the user manual and forum
- Fold the sidebar