What is Nebula Dashboard Enterprise Edition
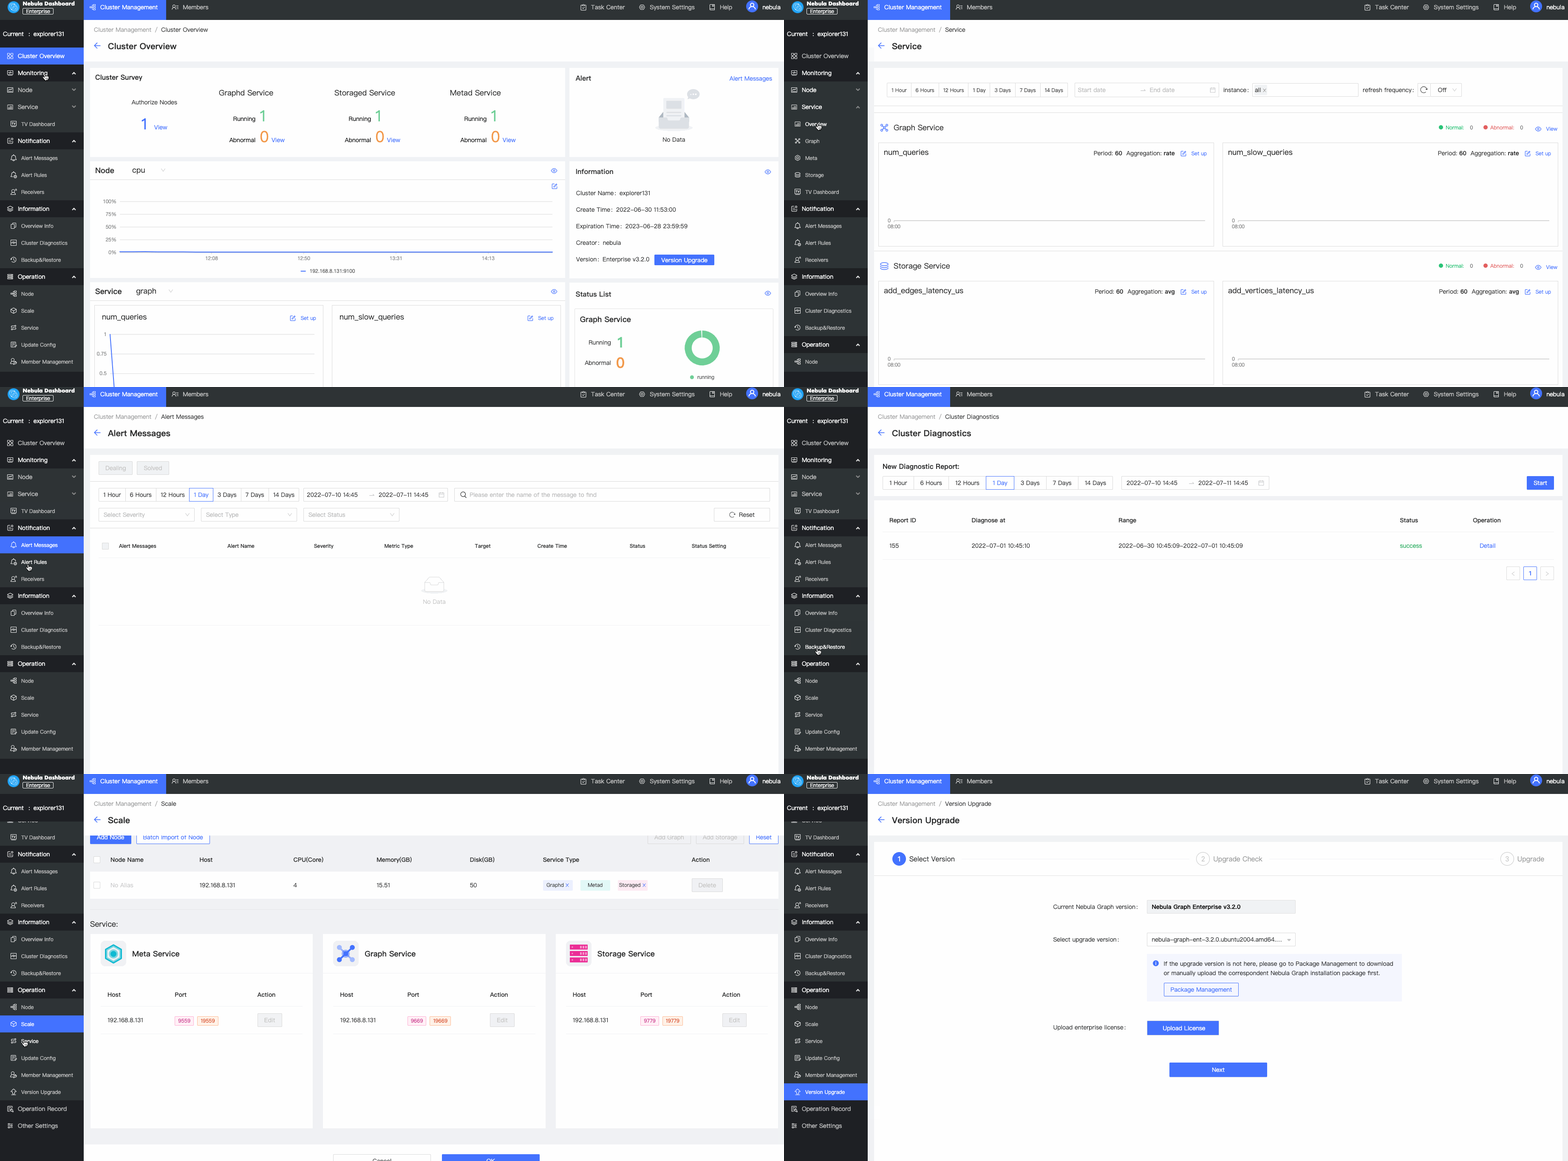
Nebula Dashboard Enterprise Edition (Dashboard for short) is a visualization tool that monitors and manages the status of machines and services in NebulaGraph clusters. This topic introduces Dashboard Enterprise Edition. For more information, see What is Nebula Dashboard Community Edition.
Note
You can also try some functions online in Dashboard.

Features
- Create a NebulaGraph cluster of a specified version, import nodes in batches, scale out NebulaGraph services with one click
- Import clusters, balance data, scale out or in on the visualization interface.
- Manage clusters, and view the operation log of clusters within the last 14 days.
- Start, stop, and restart services on the visualization interface.
- Update the configuration of Storage services and Graph services in clusters quickly.
- Set how often the metrics page refreshes.
- Monitor the information of all the services in clusters, including the IP address, version, and monitoring metrics (such as the number of queries, the latency of queries, and the latency of heartbeats).
- Monitor the status of all the machines in clusters, including CPU, memory, load, disk, and network.
- Monitor the information of clusters, including the information of services, partitions, configurations, and long-term tasks.
- Set notifications based on the monitoring information.
Scenarios
- You want a visualized operation and maintenance monitoring platform for large-scale clusters.
- You want to monitor key metrics conveniently and quickly, and present multiple key information of the business to ensure that the business can be operated normally.
- You want to monitor clusters from multiple dimensions (such as the time, aggregate rules, and metrics).
- You want to review the failure after it occurs, confirm when it happened, and view its associated phenomena.
Precautions
- The monitoring data will be retained for 14 days by default, that is, only the monitoring data within the last 14 days can be queried.
- The version of NebulaGraph must be 2.5.0 or later.
- It is recommend to use the latest version of Chrome to access Dashboard.
- It is recommend to use the official installation package to create or import clusters.
Note
The monitoring feature is supported by Prometheus. The update frequency and retention intervals can be modified. For details, see Prometheus.
Version compatibility
The version correspondence between NebulaGraph and Dashboard Enterprise Edition is as follows.
| NebulaGraph version | Dashboard version |
|---|---|
| 2.5.0 ~ 3.1.0 | 3.1.0 |
| 2.5.x ~ 3.1.0 | 3.0.4 |
| 2.5.1 ~ 3.0.0 | 1.1.0 |
| 2.0.1 ~ 2.6.1 | 1.0.2 |
| 2.0.1 ~ 2.6.1 | 1.0.1 |
| 2.0.1 ~ 2.6.1 | 1.0.0 |
Video
- Nebula Dashboard (Enterprise Edition) Intro Demo(5 minutes 25 seconds)
Last update:
March 13, 2023